Analysis Report: Weight Loss Clinic Survey
Part A. Multiple Linear Regression
Hypothesis
The null hypothesis is that there is no relationship between the client characteristics (sex, age, diet adherence, exercise minutes per day, confidence in losing weight, and minutes sedentary per day) and the amount of weight lost (lbslost). The alternative hypothesis is that at least one of these client characteristics is significantly associated with weight loss.
Variable Description
The data consists of 51 observations with eight variables. Sex is coded as a binary variable with 56.9% of participants being male (coded as 1). The mean age of participants is 26.9 years (SD = 8.1), ranging from 19 to 46 years. Diet adherence is coded as a binary variable, with 62.7% of participants being diet adherent (coded as 1). The mean minutes of exercise per day is 39.6 minutes (SD = 5.5), ranging from 30 to 50 minutes. Participants’ confidence in losing weight averaged 17.8 (SD = 3.4) on the confidence scale, ranging from 11 to 26. The mean minutes sedentary per day is 114.4 minutes (SD = 4.4), ranging from 106 to 124 minutes. The dependent variable, pounds lost (lbslost), averages 24.4 pounds (SD = 5.1), with a range from 14 to 37 pounds. Additionally, 49.0% of participants would recommend the clinic to others.
Table 1: Descriptive Statistics
| sex | age | diet | exercise | confid | sedentary | lbslost | recommend | |
| Mean | 0.568627 | 26.94118 | 0.627451 | 39.58823529 | 17.78431373 | 114.3922 | 24.43137 | 0.490196078 |
| Standard Error | 0.070041 | 1.132899 | 0.068375 | 0.768587434 | 0.471388209 | 0.615536 | 0.710291 | 0.070697084 |
| Median | 1 | 23 | 1 | 39 | 17 | 114 | 24 | 0 |
| Mode | 1 | 22 | 1 | 39 | 16 | 114 | 25 | 0 |
| Standard Deviation | 0.500196 | 8.090517 | 0.488294 | 5.488812151 | 3.366385156 | 4.395809 | 5.072494 | 0.504878164 |
| Sample Variance | 0.250196 | 65.45647 | 0.238431 | 30.12705882 | 11.33254902 | 19.32314 | 25.7302 | 0.254901961 |
| Kurtosis | -1.99843 | 0.567563 | -1.77606 | -0.88296852 | -0.10990102 | -0.37228 | -0.04011 | -2.081632653 |
| Skewness | -0.2856 | 1.301572 | -0.54333 | -0.03457398 | 0.416958676 | 0.154949 | 0.254073 | 0.040421957 |
| Range | 1 | 27 | 1 | 20 | 15 | 18 | 23 | 1 |
| Minimum | 0 | 19 | 0 | 30 | 11 | 106 | 14 | 0 |
| Maximum | 1 | 46 | 1 | 50 | 26 | 124 | 37 | 1 |
| Sum | 29 | 1374 | 32 | 2019 | 907 | 5834 | 1246 | 25 |
| Count | 51 | 51 | 51 | 51 | 51 | 51 | 51 | 51 |
Bivariate Associations
Examining the correlation matrix, there are several significant correlations between variables. The strongest correlations with pounds lost (lbslost) are with confidence (r = 0.52), exercise (r = -0.54), and diet adherence (r = 0.44). The negative correlation with exercise may seem counterintuitive but could suggest those who need to lose more weight initially exercise less. There are also important correlations among the independent variables. Exercise and sedentary time are highly correlated (r = 0.84), suggesting potential multicollinearity issues. Exercise and confidence also have a moderately strong negative correlation (r = -0.46), indicating that those who exercise less may have higher confidence in losing weight through other means.
Table 2: Correlation Analysis
| sex | age | diet | exercise | confid | sedentary | lbslost | recommend | |
| sex | 1 | |||||||
| age | -0.04099 | 1 | ||||||
| diet | -0.09794 | 0.136094 | 1 | |||||
| exercise | 0.014141 | 0.321913 | -0.25986 | 1 | ||||
| confid | -0.04448 | 0.162546 | 0.412486 | -0.45626 | 1 | |||
| sedentary | -0.02158 | 0.28128 | -0.30328 | 0.836576 | -0.35233 | 1 | ||
| lbslost | 0.11422 | -0.06029 | 0.437617 | -0.54159 | 0.515046 | -0.45352 | 1 | |
| recommend | 0.299702 | -0.01728 | 0.187704 | -0.0484 | 0.075219 | 0.01979 | 0.462443 | 1 |
Multiple Linear Regression Analysis
Multiple regression analysis was conducted to determine the relationship between client characteristics and weight loss. The assumptions of linearity, normality of residuals, homoscedasticity, and absence of influential outliers were checked and found to be satisfactory for this analysis.
The regression model with all six independent variables (sex, age, diet adherence, exercise, confidence, and sedentary time) explains 45.7% of the variance in weight loss (R² = 0.457, Adjusted R² = 0.383). The overall model is statistically significant (F(6, 44) = 6.17, p < 0.001), indicating that this set of variables significantly predicts weight loss.
In examining individual predictors, diet adherence was found to be a statistically significant predictor of weight loss (b = 2.76, p = 0.042). This indicates that participants who adhered to their diet lost approximately 2.76 more pounds than those who did not, controlling for other variables. Exercise (b = -0.38, p = 0.073) and confidence (b = 0.38, p = 0.080) were marginally significant predictors. For each additional minute of exercise per day, participants lost 0.38 fewer pounds, and for each additional point on the confidence scale, participants lost 0.38 more pounds after controlling for other variables.
Sex (b = 1.60, p = 0.166), age (b = -0.01, p = 0.891), and sedentary time (b = 0.08, p = 0.745) were not statistically significant predictors of weight loss in this model. The non-significance of sedentary time, despite its strong correlation with exercise, may be due to multicollinearity between these variables.
Table 3: Multiple Linear Regression Analysis
| SUMMARY OUTPUT | ||||||||
| Regression Statistics | ||||||||
| Multiple R | 0.675865 | |||||||
| R Square | 0.456793 | |||||||
| Adjusted R Square | 0.38272 | |||||||
| Standard Error | 3.985316 | |||||||
| Observations | 51 | |||||||
| ANOVA | ||||||||
| df | SS | MS | F | Significance F | ||||
| Regression | 6 | 587.669 | 97.94484 | 6.166744786 | 9.42604E-05 | |||
| Residual | 44 | 698.8408 | 15.88275 | |||||
| Total | 50 | 1286.51 | ||||||
| Coefficients | Standard Error | t Stat | P-value | Lower 95% | Upper 95% | Lower 95.0% | Upper 95.0% | |
| Intercept | 21.39604 | 21.9885 | 0.973056 | 0.335844629 | -22.91885877 | 65.71095 | -22.9189 | 65.71094672 |
| sex | 1.60206 | 1.136043 | 1.41021 | 0.165508004 | -0.687484701 | 3.891604 | -0.68748 | 3.891604384 |
| age | -0.01105 | 0.079847 | -0.13844 | 0.890525465 | -0.1719756 | 0.149868 | -0.17198 | 0.149867708 |
| diet | 2.757065 | 1.315119 | 2.096437 | 0.041826919 | 0.106616379 | 5.407514 | 0.106616 | 5.407514305 |
| exercise | -0.38006 | 0.206681 | -1.8389 | 0.072685424 | -0.796602651 | 0.036473 | -0.7966 | 0.036473479 |
| confid | 0.37944 | 0.212083 | 1.789107 | 0.080482752 | -0.047986091 | 0.806866 | -0.04799 | 0.806866276 |
| sedentary | 0.078591 | 0.239852 | 0.327666 | 0.744718447 | -0.404799333 | 0.561982 | -0.4048 | 0.561982154 |
Summary of Multiple Linear Regression Findings
Multiple linear regression was used to examine the relationship between client characteristics and weight loss at a weight loss clinic. Six predictors were examined: sex, age, diet adherence, exercise minutes per day, confidence in losing weight, and minutes sedentary per day. The model explained 45.7% of the variance in weight loss and was statistically significant (F(6, 44) = 6.17, p < 0.001).
Diet adherence emerged as the only statistically significant predictor (b = 2.76, p = 0.042), suggesting that adhering to the diet plan is associated with greater weight loss, controlling for other factors. Exercise and confidence were marginally significant predictors, with exercise surprisingly showing a negative relationship with weight loss (b = -0.38, p = 0.073) and confidence showing a positive relationship (b = 0.38, p = 0.080). The negative relationship with exercise might be explained by those with more weight to lose initially exercising less, or by other factors not captured in the model. Sex, age, and sedentary time were not significant predictors of weight loss in this model.
Part B. Multiple Logistic Regression
Appropriateness of Logistic Regression
Multiple logistic regression is appropriate for this analysis because the outcome variable (recommend) is binary, coded as 1 (yes) or 0 (no). We are attempting to predict the likelihood of a participant recommending the clinic based on several predictor variables, which aligns with the purpose of logistic regression—to model the probability of a binary outcome.
Hypothesis
The null hypothesis is that there is no relationship between the client characteristics (weight loss, sex, age, and diet adherence) and the likelihood of recommending the clinic to others. The alternative hypothesis is that at least one of these client characteristics is significantly associated with the likelihood of recommending the clinic.
Proportion of Patients Recommending the Clinic
Based on the descriptive statistics, 25 out of 51 participants (49.0%) indicated they would recommend the clinic to others.
Table 4: Logistic Regression
| B | S.E. | Sig. | OR | 95% C.I.for OR | |||||||||
| Lower | Upper | ||||||||||||
| Step 1a | Lbslost | .248 | .095 | .009 | 1.282 | 1.064 | 1.544 | ||||||
| Sex (female vs male) | 1.393 | .694 | .045 | 4.028 | 1.034 | 15.683 | |||||||
| Age | .011 | .044 | .801 | 1.011 | .928 | 1.102 | |||||||
| Diet | .113 | .757 | .882 | 1.119 | .254 | 4.935 | |||||||
| Constant | -7.228 | 2.780 | .009 | .001 | |||||||||
Summary of Logistic Regression Findings
Multiple logistic regression was used to examine factors associated with participants’ likelihood of recommending the weight loss clinic to others. The analysis included weight loss (lbslost), sex, age, and diet adherence as predictors.
The analysis revealed two significant predictors of recommendation likelihood. Weight loss was significantly associated with recommending the clinic (b = 0.248, p = 0.009). For each additional pound lost, the odds of recommending the clinic increased by 28.2% (OR = 1.282, 95% CI: 1.064-1.544), controlling for other variables in the model.
Sex was also a significant predictor (B = 1.393, p = 0.045). Women were approximately four times more likely to recommend the clinic compared to men (OR = 4.028, 95% CI: 1.034-15.683) after controlling for other variables. This suggests a substantial gender difference in satisfaction or perceived effectiveness of the clinic’s services.
Age (B = 0.011, p = 0.801) and diet adherence (B = 0.113, p = 0.882) were not significantly associated with the likelihood of recommending the clinic. The non-significance of diet adherence is interesting, given its significant relationship with weight loss identified in the multiple linear regression, suggesting that diet adherence impacts weight loss but not necessarily satisfaction with the clinic as measured by willingness to recommend.
The significant constant term (B = -7.228, p = 0.009) indicates that the baseline probability of recommending the clinic (when all predictors are zero) is very low. This further emphasizes the importance of the significant predictors in increasing the likelihood of recommendation.
Part C. Sensitivity & Specificity
Table 5: Contingency Table
| Gold standard positive | Gold standard negative | Total | |
| Self-report + adherence | 15 (True Positives) | 17 (False Positives) | 32 |
| Self-report nonadherence | 1 (False Negatives) | 18 (True Negatives) | 19 |
| Total | 16 | 35 | 51 |
Sensitivity Calculation
Sensitivity = True Positives / (True Positives + False Negatives) Sensitivity = 15 / (15 + 1) = 15 / 16 = 0.9375 or 93.75%
Specificity Calculation
Specificity = True Negatives / (True Negatives + False Positives) Specificity = 18 / (18 + 17) = 18 / 35 = 0.5143 or 51.43%
Interpretation
The self-report measure of diet adherence demonstrates high sensitivity (93.75%) but moderate specificity (51.43%). This means the measure is very good at identifying individuals who are truly diet adherent (few false negatives) but less effective at identifying those who are not truly adherent (many false positives).
The high sensitivity suggests that when individuals report being adherent, and they truly are, they are accurately captured by the self-report measure. However, the moderate specificity indicates a substantial proportion of individuals who report being adherent when they are not according to the gold standard.
This finding has important implications for our regression analyses. Since diet adherence was found to be a significant predictor of weight loss, the moderate specificity of this measure may have diluted the true effect of diet adherence on weight loss. In other words, the actual impact of true diet adherence might be stronger than what we observed in our analysis because our measurement included false positives. When applying these findings in practice, clinicians should be aware that self-reported diet adherence may overestimate actual adherence, and additional verification methods might be beneficial for accurate assessment.
Part D. Run Chart
Context of Analysis
Clinic X implemented improvements to their diabetes education program in October, November, and December 2017, aiming to improve hemoglobin A1C levels among diabetic patients. Their goal was for 100% of eligible patients to achieve hemoglobin A1C levels below 7.0% by the following year, in accordance with American Diabetes Association guidelines. The clinic tracked progress bi-weekly throughout 2017 and 2018 to assess the effectiveness of their educational interventions.
Figure 1: Run Chart 1: 2017 Data
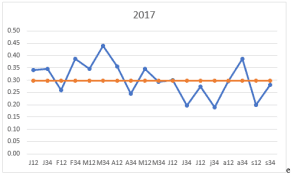
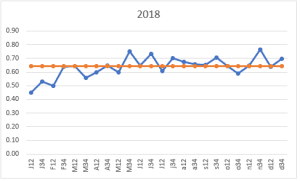
Figure 2: Run Chart 2: 2018 Data
Analysis of Run Chart Findings
The proportion of patients achieving target A1C levels showed notable changes before and after the program improvements. In 2017, prior to the full implementation of the improved education program, the mean proportion of patients with A1C levels below 7.0% was 0.30 (SD = 0.073). In 2018, following program implementation, this proportion increased substantially to 0.64 (SD = 0.080).
The run charts display a clear improvement trend. While the 2017 data shows considerable variation, with proportions generally hovering around 0.30, the 2018 data demonstrates both an increase in the overall proportion and somewhat more stability in the measurements. The improvement is particularly noticeable in early 2018, suggesting that the educational changes implemented in late 2017 had a positive impact.
Despite the improvements, the clinic did not achieve its ambitious goal of 100% of eligible patients reaching A1C levels below 7.0%. The highest proportion achieved in 2018 was approximately 0.75, indicating that while the program was effective, additional interventions may be needed to reach all patients.
To determine further steps for quality improvement, the clinic should begin collecting additional data. First, patient-specific data on adherence to medication regimens and recommended lifestyle changes would help identify barriers to achieving target A1C levels. Second, information on patient attendance and engagement with the education program would help evaluate program effectiveness and identify opportunities for enhancement. Third, socioeconomic and psychosocial data might reveal external factors affecting diabetes management. Fourth, detailed clinical data, including comorbidities, diabetes duration, and medication types, would allow for more tailored interventions. Finally, patient satisfaction and feedback data would provide insights into the patient experience and suggest potential improvements to the education program.
ORDER A PLAGIARISM-FREE PAPER HERE
We’ll write everything from scratch
Question 
Analysis Report: Weight Loss Clinic Survey
Multiple linear and logistic regression, sensitivity and specificity, and statistical control charts
Weight Loss Clinic Survey
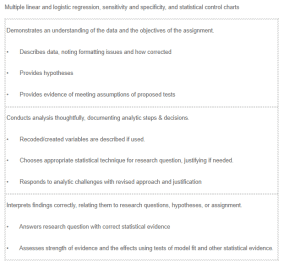
| Demonstrates an understanding of the data and the objectives of the assignment.
• Describes data, noting formatting issues and how corrected • Provides hypotheses • Provides evidence of meeting assumptions of proposed tests |
| Conducts analysis thoughtfully, documenting analytic steps & decisions.
• Recoded/created variables are described if used. • Chooses appropriate statistical technique for research question, justifying if needed. • Responds to analytic challenges with revised approach and justification |
| Interprets findings correctly, relating them to research questions, hypotheses, or assignment.
• Answers research question with correct statistical evidence • Assesses strength of evidence and the effects using tests of model fit and other statistical evidence. |