Cost Structure and Perfectly Competitive Markets
There exists a theoretical framework for a competitive market that assists in establishing the best possible outcome for society and consumers. Notably, the number of organizations is a crucial feature of perfectly competitive markets, limiting profit-making. Also, all organizations within a perfectly competitive market produce similar products, and none of them can gather so much power to influence others and the industry (Browning & Zupan, 2020). Thus, profits can only be witnessed in the short run because all possible causes of economic profits are assumed.
| Widgets produced | Fixed cost | Variable costs | Total costs | Average variable costs | Average total costs | Marginal cost | Price= MR | Revenue | Profits |
| 0 | 25 | 0 | 25 | 0 | 0 | 25 | 10 | 0 | -25 |
| 1 | 25 | 8 | 33 | 8 | 33 | 8 | 10 | 10 | -23 |
| 2 | 25 | 15 | 40 | 7.5 | 20 | 7 | 10 | 20 | -20 |
| 3 | 25 | 23 | 48 | 7.6 | 16 | 8 | 10 | 30 | -18 |
| 4 | 25 | 32 | 57 | 8 | 14.25 | 9 | 10 | 40 | -17 |
| 5 | 25 | 42 | 67 | 8.4 | 13.4 | 10 | 10 | 50 | -17 |
| 6 | 25 | 53 | 78 | 8.8 | 13 | 11 | 10 | 60 | -18 |
| 7 | 25 | 65 | 90 | 9.2 | 9.28 | 12 | 10 | 70 | -20 |
| 8 | 25 | 78 | 103 | 9.75 | 12.87 | 13 | 10 | 80 | -23 |
| 9 | 25 | 92 | 117 | 10.2 | 13 | 14 | 10 | 90 | -27 |
Profit Maximizing (Or Loss Minimizing) Level of Output in the Short Run
MR=MC=10 reflects a point in which profit maximization lies in the short run. In the above figure, it is indicated a point of level 5. Therefore, the profit maximization point is given where MR=MC in both the long and short run.
Profit Maximizing Level of Output in the Long-Run
The profit-maximizing level is given at a point where MR=MC=10. In the long run, it is a point where the marginal revenue is equivalent to the marginal cost (Kolmar, 2022). Therefore, the quantity produced at that level will result in maximum profit.
Shut-Down Prices in the Short Run and Long Run
In a perfectly competitive market, a shut-down situation occurs when the average revenue is equivalent to marginal revenue, and the average cost is equivalent to the average variable cost. The subject company produces ten units due to the average variable cost, which is higher than the average revenue at a given point in time.
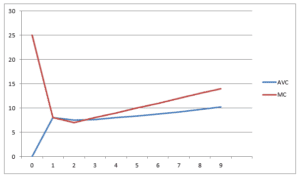
Firm’s supply curve
The above curve reflects the short-run supply in a perfectly competitive market, indicating the minimum average variable cost curve under the marginal cost curve. The y-axis represents AVC/MC, while the x-axis represents the number of widgets produced.
Figure 1: Table showing the industry supply curve:
| Quantity | Supply |
| 0 | 9 |
| 1 | 8 |
| 2 | 7 |
| 3 | 6 |
| 4 | 5 |
| 5 | 4 |
| 6 | 3 |
| 7 | 2 |
| 8 | 1 |
| 9 | 0 |
It is assumed that the number of market industries will increase over time. If ten firms derive positive economic gains from the market, many other firms will likely join the market in the long run, increasing the number of firms (Glasserman & Nouri, 2016). Notably, this will shift the supply curve to the right. The shift will indicate a decline in the equilibrium price for the product in question. Due to the competition prevailing in the current market, firms will accept the existing equilibrium price.
References
Browning, E. K., & Zupan, M. A. (2020). Microeconomics: Theory and applications. John Wiley & Sons.
Glasserman, P., & Nouri, B. (2016). Market‐triggered changes in capital structure: Equilibrium price dynamics. Econometrica, 84(6), 2113-2153.
Kolmar, M. (2022). Firm Behavior Under Perfect Competition. In Principles of Microeconomics (pp. 377-397). Springer, Cham.
ORDER A PLAGIARISM-FREE PAPER HERE
We’ll write everything from scratch
Question
As highlighted in this week’s Learning Resources, typical firms in perfectly competitive markets will find the optimal ways to use and allocate their resources to be as efficient as possible and achieve success in the long run. In part, this outcome is due to the nature of firm cost functions and their influence on output and pricing decisions related to profit maximization. For example, if there are two vegetable sellers at a farmer’s market, they may not be able to compete with each other in price because of how low the prices are already. However, if one seller has to hire help to grow the vegetables and the other has found a more efficient way to grow them without help, then that other seller will likely be able to stay in business longer because there are no payroll expenses.

Cost Structure and Perfectly Competitive Markets
In this Assignment, you will address concepts of cost structure and perfectly competitive markets, including the relationship between a typical firm’s cost functions and its pricing and output decisions.
To prepare for this Assignment:
Review this week’s learning resources, particularly the material on firm and industry cost functions.
Refer to the Academic Writing Expectations for 1000-Level Courses as you compose your Assignment.
By Day 7
Submit your responses to the following prompts.
Using the definition and characteristics of perfectly competitive industries, explain why—in the long run—firms earn zero economic profits. Does this mean that competitive firms earn zero accounting profits? Your response should be at least 75–150 words (1–2 paragraphs) in length.
Joe’s Widget Factory operates in a perfectly competitive industry. Joe’s fixed and variable costs are given in the table below. He is a price taker and can sell as many widgets as he produces for $10 each. Complete the table using the provided link and respond to the following questions. Besides referring to your table to support your answers, include references from the course materials on profit-maximizing rules for competitive firms. Your response should be at least 75–150 words (1–2 paragraphs) in length, including table.
What is the profit-maximizing (or loss-minimizing) level of output in the short run?
What is the profit-maximizing level of output in the long run?
What are the shut-down prices in the short run and long run?
What is the firm’s supply curve?
Note: Use this Week 3 Assignment Worksheet to complete the following table. Be sure to incorporate your table into your Assignment submission. (WORKSHEET HAS BEEN ATTACHED)
Widgets Produced Fixed Costs Variable Costs Total Costs Average Variable Cost Average Total Cost Marginal Cost Price = MR Profits
0 25 0 10
1 25 8 10
2 25 15 10
3 25 23 10
4 25 32 10
5 25 42 10
6 25 53 10
7 25 65 10
8 25 78 10
9 25 92 10
Based on your answers to the previous set of questions, assuming there are 100 identical firms in the widget industry, construct a table showing the industry supply curve. Then, explain what you expect will happen over time to the number of firms in the industry and the equilibrium industry price of widgets. Your response should be at least 75–150 words (1–2 paragraphs) in length, including the table.


