Estimates and Confidence Intervals – XYZ Company
The point estimate of the number of respondents who answered “office” can be calculated by multiplying the sample size by the sample proportion:
- Number of respondents who answered “office” = 1,003 x 0.372 ≈ 373.
To construct a 95% confidence interval estimate of the true proportion of all employees who would like to work at the office, we use the formula:
- Confidence interval = sample proportion ± (critical value) x (standard error).
Given information:
- Sample proportion (p̂) = 0.372
- Sample size (n) = 1,003
- Critical value (z) for a 95% confidence level = 1.96
The standard error is calculated as follows:
- Standard error (SE) = sqrt[(p̂ * (1 – p̂)) / n]
- Standard error (SE) = sqrt[(0.372 * 0.628) / 1,003] ≈ 0.018
Now, we can construct the confidence interval:
- Confidence interval = 0.372 ± (1.96 * 0.018)
- Confidence interval ≈ (0.337, 0.407) rounded to one decimal digit.
So, the 95% confidence interval estimate of the true proportion of employees who would like to work in the office is approximately (33.7%, 40.7%).
To test whether the majority (more than 50%) of employees would like to come back to the office, we can set up the following null and alternative hypotheses:
- Null Hypothesis (H0): The true proportion of employees who would like to work in the office is less than or equal to 50%.
H0: p ≤ 0.5
- Alternative Hypothesis (Ha): The true proportion of employees who would like to work in the office is greater than 50%.
Ha: p > 0.5
We will use a significance level of 0.05 for the hypothesis test.
Next, we calculate the test statistic (z-score):
z = (sample proportion – hypothesized proportion) / standard error
where the hypothesized proportion is 0.5 (50%), and the standard error is 0.018.
Plugging in the values, we get:
z = (0.372 – 0.5) / 0.018 ≈ -7.11
Using the standard normal distribution table, we find that the p-value is less than 0.0001.
Therefore, since the p-value is less than the significance level of 0.05, we reject the null hypothesis. We conclude that there is strong evidence to suggest that most employees (more than 50%) would like to return to the office for the upcoming year.
In conclusion, based on the survey results and the hypothesis test, it appears that a significant proportion of employees at XYZ Company prefer to work in the office rather than continue working from home. The leadership should consider these findings while making decisions about the work arrangement policies for the upcoming year and ensure that the transition back to the office is carried out with proper planning and employee engagement.
ORDER A PLAGIARISM-FREE PAPER HERE
We’ll write everything from scratch
Question
The recent pandemic greatly affected the working environment. According to a survey, post-pandemic employees are more than ever demanding changes to policies and benefits in the workplace.

Estimates and Confidence Intervals – XYZ Company
Your organization, XYZ Company, notes several hurdles to attracting and retaining staff in the post-pandemic climate. One example is the employer’s inability to adjust to the remote work arrangement, and another is a lack of pay equity commitment.
In keeping with XYZ Company’s goal to treat employees well, management is looking for feedback to measure the company’s performance as the employer of choice.
You work as the Manager of Workforce Analytics within the Human Resources department. The company is growing rapidly, and your boss, Jane, who is the Chief People Officer (CPO), wants to make sure that the company is treating its employees equitably. She is analysis-driven, so she taps you to work on several projects to uncover any potential issues. Her objectives are to:
Describe the current state of salary data using the measures of central tendency and variability.
Give a point estimate and construct a confidence interval of the number of employees who want to work remotely.
Conduct a hypothesis test from two populations, male employees and female employees, of a claim that they have the same mean salary.
Test a claim that employee pay is on par with industry standards with a hypothesis test from one population.
Apply a normal distribution to review the current dental insurance plan expenses.
Identify any correlation between seniority and pay
Conduct a regression analysis between employee age and salary
Let’s get started and gather insights into the workforce data.
Click the ‘scenario’ button below to review the topic and then answer the following question:
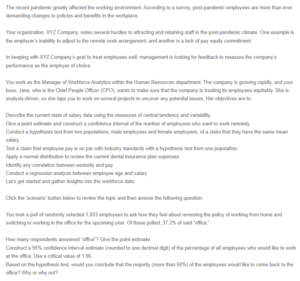
You took a poll of randomly selected 1,003 employees to ask how they feel about reversing the policy of working from home and switching to working in the office for the upcoming year. Of those polled, 37.2% of said “office.”
How many respondents answered “office”? Give the point estimate.
Construct a 95% confidence interval estimate (rounded to one decimal digit) of the percentage of all employees who would like to work at the office. Use a critical value of 1.96.
Based on the hypothesis test, would you conclude that the majority (more than 50%) of the employees would like to come back to the office? Why or why not?

