Overview of Financial Statement – Hillside Inc
Do you need help with your assignment ? Reach out to us.
The chosen ratios are highlighted below.
Liquidity Ratios
Current Ratio
The capability of the organization to make payments on its short-term obligations is better demonstrated by a larger current ratio (above 1) (Kliestik et al., 2020). The corporation may need to use its current assets more effectively if the current ratio is very high. The calculated current ratio for the company is 1.75, which is above 1. Hence, it shows that the company is in a great position to pay its short-term obligation.
Quick Ratio
Compared to the current ratio, the quick ratio is a stricter measure of a business’s liquidity. Inventory is not encompassed in current assets since it might occasionally take time to turn inventory into cash fast (Kliestik et al., 2020). With the help of this ratio, it is possible to see more clearly how well a corporation can pay short-term obligations without having to sell inventory. The company’s quick ratio is 0.51, which is less than one; hence, it indicates that the company does not have sufficient quick assets to cover all its short-term obligations.
Average Payment Period (Days)
The average payment period, commonly called the accounts payable turnover ratio, counts the days a business takes to pay its supplier (Kliestik et al., 2020). A shorter average payment duration shows that the business is paying its suppliers more rapidly, which is advantageous for preserving excellent supplier relationships and obtaining favorable conditions. The average payment period of the company is 12 days, which is a short period that shows that the company quickly pays its supplies, hence maintaining a good relationship with its suppliers.
Asset Management Ratios
Total Asset Turnover (Times)
The efficiency with which a company utilizes its possessions to generate income is measured by its total asset turnover ratio. A more excellent total asset turnover ratio shows that the business uses its assets to produce revenues successfully. The company’s total asset turnover is 2.9 times, which indicates that the company uses its assets effectively to generate income.
Average Collection Period (Days)
The amount of time a company takes to collect its accounts receivable is measured by the average collection period, commonly called the accounts receivable turnover ratio. The average collection period for the company is 12 days. This indicates that the company has a short period of paying its suppliers and maintains a good relationship with them.
Inventory Turnover (Times)
The inventory turnover ratio calculates how frequently a corporation sells and replenishes its stock over a specific period. The inventory turnover is 7.87, which means that the company replenishes its stock 7.87 times.
Financial Leverage Ratios
Total Debt to Total Assets
The percentage of a business’s resources that are financed by debt is determined by this ratio. The company’s total debt to total assetsis 7.02%, which means that the company has more debt than its assets.
Equity Multiplier (Times)
The financial leverage ratio, called the equity multiplier, calculates how much of a company’s assets are backed by equity. The company’s equity multiplier is 1.59 times, meaning that the company is using more equity than debt to finance its assets.
Profitability Ratios
Operating Profit Margin
An organization’s operational profitability is gauged by its operating profit margin. The operating profit margin is 5.66% which is relatively good for the company.
Net Profit Margin
When all expenditures, such as taxes and interest, are considered, the net profit margin provides a comprehensive picture of a company’s profitability. The net profit margin for the company is 27.56%, which means the company is more effective when converting assets into actual sales.
Return on Total Assets
A financial ratio called return on total assets assesses a company’s profitability concerning its total assets. It shows how well a business is using its resources to make money. The company’s return on total assets is 10.32, which means the company is effectively utilizing its resources to generate income.
Return on Equity
Return on equity is a vital financial measurement that gauges an organization’s performance from the viewpoint of its shareholders. In connection to the shareholders’ equity, it demonstrates how much profit the firm is making. The company’s return on equity is 16.36%, which indicates that from the standpoint of the shareholders, the company is performing well.
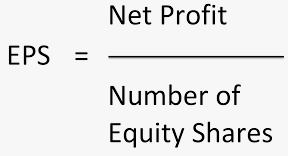
Earnings per Share
Earnings per share calculate the percentage of a business’s profit apportioned to each current share of common stock (Kliestik et al., 2020). The capacity to assess a company’s profitability per share is a crucial statistic for investors. The company’s earnings per share is 1.23, which indicates that the next dividend payments will be 1.23 dollars per share.
References
Kliestik, T., Valaskova, K., Lazaroiu, G., Kovacova, M., & Vrbka, J. (2020). Remaining financially healthy and competitive: The role of financial predictors. Journal of Competitiveness, (1).
ORDER A PLAGIARISM-FREE PAPER HERE
We’ll write everything from scratch
Question

Overview of Financial Statement
Financial ratios help identify the strengths and weaknesses of a company through the analysis of financial statements and financial calculations. For this discussion, imagine you are a financial analyst for a company and your company is evaluating the purchase of another company, Hillside, Inc. This week, you’ll review a balance sheet and income statement for Hillside, Inc., and then calculate common financial ratios to evaluate the company’s financial performance.
Financial Analysis Calculations. Use this balance sheet information to choose 1 financial ratio that you will need to calculate for Hillside, Inc., and answer the following:
Which ratio did you choose? Explain what this ratio means.
What were the results of your calculation? Show your work to the class, including the formula you used and the data you input for your calculation.


