Data Plotting and Information Analysis
People in various cities and states have been infected by an infectious virus. Cases have been reported in fifty cities and twenty-nine states. This paper uses a plotted chart to identify high-risk and low-risk states, cities, and areas. Furthermore, the paper analyzes how information from previous assignments can impact a healthcare facility.
High-Risk and Low-Risk Cities and States
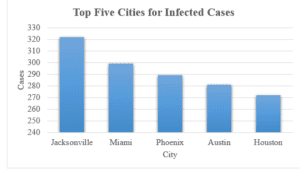
Evaluation of cases recorded in February, March, and April reveal differences in the number of cases recorded across various cities and states. High-risk cities are indicated by the high number of cases recorded. In this scenario, high-risk cities include Jacksonville, Miami, Phoenix, Austin, New Orleans, and Houston, with 429, 392, 390, 368, 361, and 310 cases, respectively. The other high-risk cities include San Diego, Mesa, Atlanta, New York, Long Beach, Fresno, and Los Angeles, with 299, 268, 266, 264, 247, 245, and 219 cases, respectively. On the other hand, low-risk cities include Omaha, Virginia Beach, Colorado Springs, Philadelphia, and Indianapolis, with 3, 4, 5, 6, and 9 cases, respectively. The low-risk cities include Oklahoma (13 cases), Minneapolis (13 cases), Arlington (14 cases), Milwaukee (16 cases), Chicago (17 cases), and Columbus (20 cases).
Further evaluation reveals that high-risk states include California, Texas, Florida, and Arizona, with 1056, 821, and 783 cases, respectively. The other states with high cases include Louisiana, Georgia, and New York, with 361. 266 and 264 cases, respectively. Low-risk states include Nebraska (3 cases), Pennsylvania (6 cases), and Indiana (9 cases). Other states with low cases include Minnesota (13 cases), Wisconsin (16 cases), Illinois (17 cases), Virginia (18 cases), and Ohio (20 cases).
High-Risk and Low-Risk Areas
High-risk areas include north-eastern, north-western, western, southern, central, and eastern parts of the USA. Low-risk areas include the mid-western region and the northern region. Authorities from high-risk regions should formulate pertinent strategies to prevent the spread of the disease.
Additional Information
Evaluation of the chart reveals regions with the highest prevalence of viral infection. For instance, California, Texas, Florida, and Arizona residents are at the greatest risk of infection. Authorities from these states should implement pertinent strategies to avert the spread of the virus. Also, residents of Nebraska, Pennsylvania, Indiana, Minnesota, Wisconsin, Illinois, Virginia, and Ohio are at the lowest risk of infection. Resource allocation to combat the virus should target high-risk areas.
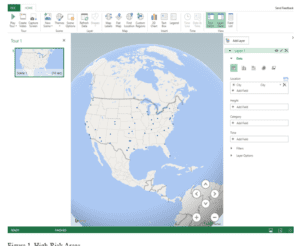
Figure 1. High-Risk Areas
Part II: Information Analysis
My previous assessment focused on the analysis of data across fifty states. Notably, the assessment focused on the top affected cities. These cities include Jacksonville, Miami, Phoenix, Austin, and Houston. Furthermore, the assessment identified the prevalence rate of the infection in the cities, affected age groups, and the prevalence rate of the infection per age group. For this analysis, the selected healthcare facility is a hospital.
Benefits of Information Analysis to the Hospital
Information from my previous assignment is invaluable to a hospital operating in any of the five cities: Jacksonville, Miami, Phoenix, Austin, and Houston. Firstly, information on the number of cases and prevalence rate in each city will enable the hospitals to initiate plans to manage the outbreak effectively. For instance, this information will enable hospitals to formulate policies and protocols to optimize care, minimize further spread, and avert the possibility of staff shortages. Staff shortages are a relevant issue because it lead to burnout and lower the quality of care (Pace & Fainguersch, 2020). The policies should focus on aspects such as resource allocation to acquire sufficient personal protective equipment, expand bed capacity, create adequate isolation facilities, and recruit additional nurses and other healthcare providers (Adashi & Cohen, 2022). Adequate planning increases the likelihood of managing infectious diseases. The planning should be initiated by the heads of departments and the hospital’s management. The plan should identify clear and concise goals and a roadmap for fulfilling the goals. Also, the plans should include key performance indicators and milestones.
Secondly, information on the affected age groups and the prevalence of the disease among various age groups will enable the hospitals to achieve patient-centeredness. For instance, the most affected age group in Jacksonville comprises individuals aged 61 years and above. Hospitals in these cities should train their healthcare providers on the appropriate care for geriatrics. This is a special group because they are likely to have underlying medical conditions and require dosage modifications. On the other hand, the most affected age group in Miami, Phoenix, and Austin comprises individuals aged 18 years and below. In this context, hospitals should train their healthcare providers on the appropriate care for pediatrics. Additionally, hospitals should provide inclusive, culturally sensitive, holistic care to all patients.
Conflicts of Interest, Ethical Considerations, or Community Health Effects
Hospitals should uphold ethical principles when planning initiatives to manage the virus and when offering patient-centered care. They should embrace autonomy. Patients and their families should be involved in making decisions regarding their treatment (Varkey, 2021). Also, healthcare providers should uphold beneficence and non-maleficence. Benefits accrued from the care plans should outweigh potential risks (Varkey, 2021). Furthermore, they should not discriminate against any patient or their family. When healthcare technology is used in patient management, patient data privacy, security, and confidentiality should be upheld. This applies to technologies such as telemedicine and electronic medical records (Snoswell et al., 2020).
It is anticipated that some patients may fail to afford the cost of healthcare services. This is common among low-income communities and communities with high unemployment rates (Ayón et al., 2020). Ethnic minorities and immigrants are likely to constitute a significant portion of this population. Hospitals should aim to lower healthcare costs. The administration can explore payment plans for patients who cannot afford healthcare costs. The primary focus should not be on the profits but on the quality of care. Furthermore, hospitals should be involved in the advocacy for affordable healthcare coverage.
Further Research
Further research on the data should reveal the mortality rates associated with the disease and the existence of comorbidities among the affected population. Information on the mortality rates will demonstrate the virulence of the disease and enable hospitals and other stakeholders to make informed decisions when planning for its management. Information on the underlying comorbidities will optimize patient-centeredness and holistic care. Also, further research into the hospitals’ culture will reveal their preparedness and adaptability in the wake of the spread of infectious diseases. A positive culture that advocates for interdisciplinary collaboration, research, and cultural sensitivity is likely to optimize disease control. On the other hand, an individualistic culture is likely to impede efforts to manage the disease.
Conclusion
Jacksonville, Miami, Phoenix, Austin, New Orleans, and Houston are the high-risk cities, whereas California, Texas, Florida, and Arizona are the high-risk states. Low-risk cities and states include Omaha, Virginia Beach, Colorado Springs, Philadelphia, Indianapolis, Nebraska, Pennsylvania, and Indiana. Information on the prevalence rate of the infection in the cities and affected age groups benefits hospitals by enabling them to plan adequately.
References
Adashi, E. Y., & Cohen, I. G. (2022). The pandemic preparedness program: reimagining public health. JAMA, 327(3), 219-220. https://doi.org/10.1001/jama.2021.23656
Ayón, C., Ramos Santiago, J., & López Torres, A. S. (2020). Latinx Undocumented Older Adults, Health Needs and Access to Healthcare. Journal of Immigrant and Minority Health, 22(5), 996–1009. https://doi.org/10.1007/s10903-019-00966-7
Pace, D., & Fainguersch, B. A. (2020). The Impact of the Nursing Shortage on the Quality of Care of Veterans.
Snoswell, C. L., Taylor, M. L., Comans, T. A., Smith, A. C., Gray, L. C., & Caffery, L. J. (2020). Determining if Telehealth Can Reduce Health System Costs: Scoping Review. Journal of Medical Internet Research, 22(10). https://doi.org/10.2196/17298
Varkey, B. (2021). Principles of Clinical Ethics and Their Application to Practice. Medical Principles and Practice, 30(1), 17–28. https://doi.org/10.1159/000509119
ORDER A PLAGIARISM-FREE PAPER HERE
We’ll write everything from scratch
Question 
Assignment Directions
While information can point to certain truths and reveal gaps in care that should be addressed, information is neutral until it is assigned a purpose.
As you progress in your career, you will continually return to the Triple Aim, which ensures quality management in its clear focus to improve the
patient experience, improve the health of populations, and improve the cost of care for patients. This week, you will consider the best application
for information you have learned from your data analyses.
Data Plotting and Information Analysis
Part I: Plotting Outbreak Data
Now that you know where the outbreaks are located, your organization wants to chart out the areas that pose the highest exposure risk.
Create a graph or chart using the data provided in the High Risk Areas spreadsheet to determine the areas of the country with the most risk.
Note: The chart/graph should be made directly in Microsoft Excel. For additional resources, please visit the Create a Chart MC Excel page.
Write a 350- to 525-word analysis of the data that answers the following questions:
• Which cities (states) are high risk and low risk?
• What areas of the country are high risk and low risk?
• What else can be deduced after evaluating the chart?
Include your map with your analysis, not separately. Label as a “Figure” according to APA guidelines.
Part II: Information Analysis
Compare the charts and graphs you created for the reports in previous assessments and determine conclusions based on the analysis of the
data.
Select a health care facility or service (e.g., hospital, physician practice, long-term care facility, ambulance service, pharmacy, or skilled nursing
facility).
Write a 700- to 1,050-word analysis in which you:
• Describe how your selected health care facility or service can benefit from the information you gathered and analyzed in the previous
assessments.
• Examine any conflicts of interest, ethical considerations, or community health effects that may factor into the benefits identified.