Johnson and Johnson Company Analysis
Johnson & Johnson is a US-based pharmaceutical corporation that deals in pharmaceuticals, medical devices, and other health-related consumer products. The company is ranked 36th among Fortune 500 companies based on the revenue it generates (Johnson & Johnson, n.d.). The company is so valuable that it has an AAA prime credit rating, exceeding the US government itself. Johnson and Johnson has a wide distribution network across 60 countries worldwide (Johnson & Johnson, n.d.). The company’s global presence is a key contributing factor to the company’s performance. Get in touch with us at eminencepapers.com. We offer assignment help with high professionalism.
Key Performance Indicators
Revenue
Revenue projection and forecast are important indicators of stock security. For JNJ, revenue is projected to rise, which is an indicator that the stocks are secure.
Interventional solutions
Interventional solutions basically refer to technological solutions designed to improve an organization. Since Johnson and Johnson has made bold interventions in the medical field, including the COVID-19 vaccine manufacture, the company stocks are highly valuable
Sales
The company also considers sales to be a key performance indicator for stock performance. Johnson and Johnson’s drug portfolio has increased over the years. For instance, drug sales rose from $ 4.7 billion in 2015 to $ 9.8 billion in 2018, showing a positive performance on stocks.
The Company and Its Ticker Symbol
Company: Johnson & Johnson
Ticker symbol: JNJ
Cash Flow from Operations (CFO)
CFO represents the income a company garners from regular activities, and in this case, the case, from manufacturing and selling of products. CFO does not include long-term capital investment or revenue. The CFO for JNJ includes the money made from a company’s core activities.
- JNJ’s cash flow from operations in the final quarter of 2022 was $15.844 billion (Yahoo Finance, 2022).
- The company’s CFO for 12 months for the period dated December 31, 2022, was $52.793 billion (Yahoo Finance, 2022).
Price-to-Earnings Ratio P/E
A P/E ratio is attained by dividing a stock’s closing value by current earnings per share. The tool is used to show whether the stock is undervalued or over-valued. Johnson and Johnson’s price-to-earnings ratio as of January 26, 2023, was 16.68 (Yahoo Finance, 2023).
Stock Dividends and Yield
The current TTM dividend for Johnson and Johnson as of January 26, 2023, is $4.52. On the other hand, the company’s current dividend yield is 2.67% (Wall Street Journal, 2023).
Earnings per Share Ratio (EPS)
- The company’s EPS for the last quarter of 2022 was $1.33, representing a reduction compared to the same period the previous year.
- On the other hand, the EPS for 12 months for the period ending December 31, 2022, was $6.74 (Yahoo Finance, 2022).
Revenue Estimates for the Next 12 months
- High Estimate = $18 billion
- Low Estimate = $57 billion
Revenue Estimates from the Previous Three Years
- 2022- $17.941 billion
- 2020- $20.878 billion
- 2021- $14.714 billion
Investing, Operating and Financing Cashflow for the Last 3 Years
Funds from Operations
- 2021- (27,648)
- 2020- (20,846)
- 2019- (19,551)
Funds from Investing
- 2021- (3,652)
- 2020- (3,347)
- 2019- (3,498)
Financing Activities
- 2021- (11,032)
- 2020- (10,481)
- 2019- (9,917)
Average Trade Volume
- 3-month average-36
- 10- Day average- 7.16
- Average Trade Volume-0.56
Current, A52-Week High, Estimated 1-year Stock Price
- Current stock Price- $168.37
- 52-week high- $186.69
- Stock Price estimate for the next year- $183
Hold, Sell, or Buy (Analyst Recommendation)
Analysts recommend holding Johnson and Johnson shares. JNJ’s current growth and financial health show that the company has the ability to outperform the market in the near future.
Market Cap for the Company
Market Capitalization– $439.76 billion
References
Johnson & Johnson. (n.d.). Trading Stats | Johnson & Johnson. Johnsonandjohnson.gcs-Web.com. https://johnsonandjohnson.gcs-web.com/financial-information/fundamentals/trading-statistics.
Wall Street Journal. (2023). JNJ | Johnson & Johnson Annual Cash Flow – WSJ. Www.wsj.com. https://www.wsj.com/market-data/quotes/JNJ/financials/annual/cash-flow.
Yahoo Finance. (2023). Johnson & Johnson (JNJ) Stock Price, Quote, History & News – Yahoo Finance. Finance.yahoo.com. https://finance.yahoo.com/quote/JNJ?p=JNJ&.tsrc=fin-srch.
ORDER A PLAGIARISM-FREE PAPER HERE
We’ll write everything from scratch
Question
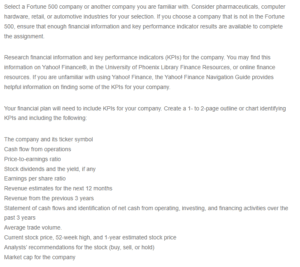
Select a Fortune 500 company or another company you are familiar with. Consider pharmaceuticals, computer hardware, retail, or automotive industries for your selection. If you choose a company that is not in the Fortune 500, ensure that enough financial information and key performance indicator results are available to complete the assignment.

Johnson and Johnson Company Analysis
Research financial information and key performance indicators (KPIs) for the company. You may find this information on Yahoo! Finance®, in the University of Phoenix Library Finance Resources, or online finance resources. If you are unfamiliar with using Yahoo! Finance, the Yahoo! Finance Navigation Guide provides helpful information on finding some of the KPIs for your company.
Your financial plan will need to include KPIs for your company. Create a 1- to 2-page outline or chart identifying KPIs and including the following:
The company and its ticker symbol
Cash flow from operations
Price-to-earnings ratio
Stock dividends and the yield, if any
Earnings per share ratio
Revenue estimates for the next 12 months
Revenue from the previous 3 years
Statement of cash flows and identification of net cash from operating, investing, and financing activities over the past 3 years
Average trade volume.
Current stock price, 52-week high, and 1-year estimated stock price
Analysts’ recommendations for the stock (buy, sell, or hold)
Market cap for the company

