Visualization of Financial Performance
The summary presented in this paper offers insights into the financial statements of both Company A and Company B. Particularly, the aspects addressed include assets, liabilities, equity, and revenues and earnings (Prasoona & Reddy, 2021). An observation regarding the changes in these aspects across three years is for both companies. Visualization tools presented column charts indicating the difference across the three years analyzed. The diagrams make it easier to point out both similarities and differences.
Are you in need of urgent assignment help ? Get in touch with us. Our services are second to none.
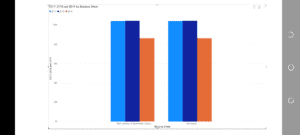
For the case of Company A, a relatively stable and static balance sheet is observed in the three years. However, a drop is identified going into 2019 from 2018, directly associated with paying a debt of $20,000. The graph below indicates the changes in assets, liabilities, and owners (2017, 2018, and 2019).
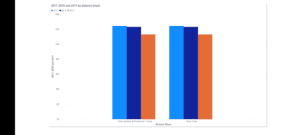
Compared with Company B, a relatively static balance sheet is also observed. There was a decline in inventories for company B from 2017 to 2018 by 1,000. Further, they also used their cash to pay their debt. The significant difference between the balance sheet of Company A and Company B is the retained earnings. Notably, retained earnings and less cash for Company A are more than those of Company B, which has a higher debt than Company A. Company A and Company B are $10,000 and $80,000, respectively.
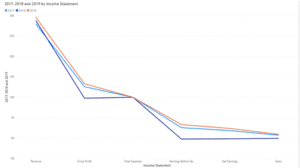
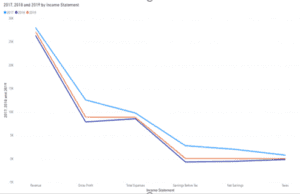
Both companies had equal revenues, cost of goods sold, and gross profit in 2017. However, the net earnings for Company B are higher due to lower rent and salaries paid. As indicated in the first curve below, there has been continued growth in three years by company A. Notably, the company incurred a significant increase in the cost of goods sold, negatively impacting the firm’s earnings. Despite the loss, there was a substantial recovery in 2019, which saw an improvement in profits and net revenues compared to the previous two years. Further, the income statement indicates consistency in expenses and low-interest payments for Company A in the three years, while there were fluctuations in costs over the three years. Further, Company B’s interest is twice that of Company A. As shown in the second graph, the figures of Company B remained down from 2017, unlike those of Company A, which adopted a remarkable recovery in 2018, as indicated in the first graph below.
Solid performance is shown for both companies regarding the aspects of income statements and the balance sheet. However, Company A performed relatively better when its higher profits and revenues were considered, and its lower debt levels were considered. For the case of Company B, an ascertainment regarding the addition of debt by TransGlobal is necessary for comparison to their current debt level. However, the company has an excellent chance to improve and hit its high profits in 2017 of $80,000.
References
Prasoona, J., & Reddy, R. G. (2021). Analysis of financial statements. Biotica Research Today, 3(5), 373-375.
ORDER A PLAGIARISM-FREE PAPER HERE
We’ll write everything from scratch
Question
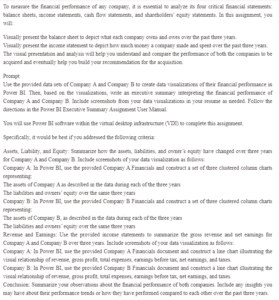
To measure the financial performance of any company, it is essential to analyze its four critical financial statements: balance sheets, income statements, cash flow statements, and shareholders’ equity statements. In this assignment, you will:
Visualization of Financial Performance
Visually present the balance sheet to depict what each company owns and owes over the past three years.
Visually present the income statement to depict how much money a company made and spent over the past three years.
The visual presentation and analysis will help you understand and compare the performance of both the companies to be acquired and eventually help you build your recommendation for the acquisition.
Prompt
Use the provided data sets of Company A and Company B to create data visualizations of their financial performance in Power BI. Then, based on the visualizations, write an executive summary interpreting the financial performance of Company A and Company B. Include screenshots from your data visualizations in your resume as needed. Follow the directions in the Power BI Executive Summary Assignment User Manual.
You will complete this assignment using Power BI software within the virtual desktop infrastructure (VDI).
Specifically, it would be best if you addressed the following criteria:
Assets, Liability, and Equity: Summarize how the assets, liabilities, and owner’s equity have changed over three years for Company A and Company B. Include screenshots of your data visualization as follows:
Company A: In Power BI, use the provided Company A Financials and construct a set of three clustered column charts representing:
The assets of Company A as described in the data during each of the three years
The liabilities and owners’ equity over the same three years
Company B: In Power BI, use the provided Company B Financials and construct a set of three clustered column charts representing:
The assets of Company B, as described in the data during each of the three years
The liabilities and owners’ equity over the same three years
Revenue and Earnings: Use the provided income statements to summarize the gross revenue and net earnings for Company A and Company B over three years. Include screenshots of your data visualization as follows:
Company A: In Power BI, use the provided Company A Financials document and construct a line chart illustrating the visual relationship of revenue, gross profit, total expenses, earnings before tax, net earnings, and taxes.
Company B: In Power BI, use the provided Company B Financials document and construct a line chart illustrating the visual relationship of revenue, gross profit, total expenses, earnings before tax, net earnings, and taxes.
Conclusion: Summarize your observations about the financial performance of both companies. Include any insights you may have about their performance trends or how they have performed compared to each other over the past three years.

