Sales Forecasting
Problem 4
Listing out the provided data, St and Ft represent the sales and forecast for period’ t.’
I am taking t = 1,2,3,4,5 and 6 for January, February, March, April, May, and June, respectively.
S1 = 45 units
S2 = 30 units
S3 = 40 units
S4 = 50 units
S5 = 55 units
S6 = 47 units
Do you need an originally done homework copy of “Sales Forecasting”? Reach out to us.
Calculate the forecast for March.
The following formula gives the sales forecast for a given period:
F_(t+1)=S_t
The following formula gives the forecast using the two-period moving average:
F_(t+1)=(S_t+S_(t-1))/2
We are applying the above formulas to calculate the forecasts.
| Month | Actual Sales | Naïve Method | 2-Period Moving Average |
| January | 45 | ||
| February | 30 | ||
| March | 40 | 30 | 37.5 |
| April | 50 | 40 | 35 |
| May | 55 | 50 | 45 |
| June | 47 | 55 | 52.5 |
From the table, using the naive method, the forecasts for March, April, May, and June are approximately 30, 40, 50, and 55 units, respectively.
From the table, using the two moving average method, the forecasts for March, April, May, and June are approximately 38, 35, 45, and 53 units, respectively.
To evaluate the forecasts using the exponential smoothing method, apply the exponential smoothing formula below:
For the initial month of March, assuming the forecast for March is equal to the actual demand for February.
Applying the above formula to evaluate the forecast:
| Month | Actual Sales | Exponential Smoothing Method |
| January | 45 | |
| February | 30 | |
| March | 40 | 30 |
| April | 50 | 32 |
| May | 55 | 35.6 |
| June | 47 | 39.48 |
From the table, using the exponential method, the forecasts for March, April, May, and June are approximately 30, 32, 36, and 40 units, respectively.
The Mean Absolute Deviation (MAD) is evaluated using the following formula:
MAD=(∑▒〖|Actual-Forecast|〗)/n
Where ‘n’ is the number of forecasts.
Applying the above formula to the three sets of forecasts gives the table below.
| Month | Actual Sales | Naïve Method | Absolute Error | 2-Period Moving Average | Absolute Error | Exponential Smoothing Method | Absolute Error |
| January | 45 | ||||||
| February | 30 | ||||||
| March | 40 | 30 | 10 | 37.5 | 2.5 | 30 | 10 |
| April | 50 | 40 | 10 | 35 | 15 | 32 | 18 |
| May | 55 | 50 | 5 | 45 | 10 | 35.6 | 19.4 |
| June | 47 | 55 | 8 | 52.5 | 5.5 | 39.48 | 7.52 |
| Total | 33 | 33 | 54.92 |
I am calculating the MAD for each method.
MAD=(∑▒〖|Actual-Forecast|〗)/n
- Naïve method.
MAD=33/4=8.25
- Two Moving Averages Method.
MAD=33/4=8.25
- Exponential Smoothing Method.
MAD=54.92/4=13.73
From the calculations above, the naïve and two-moving average methods give the lowest value of MAD. Therefore, these methods provide the most accurate forecast.
The two-moving average method gives the most accurate results. The forecast for July using this method.
F_7=(55+47)/2=51
Therefore, the sales forecast for July is 51 units.
Similar Post: Suprise of the Dialogue of Discovery
References
Reid, R. D., & Sanders, N. R. (2016). Operations Management, Binder Ready Version: An Integrated Approach. John Wiley & Sons.
ORDER A PLAGIARISM-FREE PAPER HERE
We’ll write everything from scratch
Question 
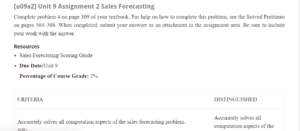
[u09a2] Unit 9 Assignment 2 Sales Forecasting
Complete problem four on page 309 of your textbook. For help completing this problem, see the Solved Problems on pages 304–308.

Sales Forecasting
When completed, submit your answers as an attachment in the assignment area. Be sure to include your work with the answer.
Resources
- Sales Forecasting Scoring Guide
- Due Date: Unit 9
Percentage of Course Grade: 2%.
| CRITERIA | DISTINGUISHED |
| Accurately solves all computation aspects of the sales forecasting problem. 50% |
Accurately solves all computation aspects of the problem and shows work. |
| Provides summary and rationale helpful in interpreting the sales forecasting results. 50% |
Accurately summarizes salient points with supporting rationale for interpreting results. |