Business Research Data
Descriptive Statistics for the Load Factor, Passenger Miles, and Seat Miles for the US Domestic Airlines
| Load Factor | |
| Mean | 81.05774 |
| Standard Error | 0.426528 |
| Median | 81.43 |
| Mode | 81.43 |
| Standard Deviation | 3.909197 |
| Sample Variance | 15.28182 |
| Kurtosis | -0.65123 |
| Skewness | -0.41697 |
| Range | 14.86 |
| Minimum | 72.29 |
| Maximum | 87.15 |
| Sum | 6808.85 |
| Count | 84 |
The cumulative mean for the monthly load factor for all US domestic airlines is 81.05774. This is close to the mode and the median of the cumulative values hence the small negative skewness. The smallest load factor value from January 2006 to December 2012 was 72.29; the highest value observed was 87.15. The sample variance and the data’s standard deviation are also obtained. The variance implies the data points are close to each other and are also close to the mean.
| Passenger Miles (000) | |
| Mean | 47134040 |
| Standard Error | 497935.4 |
| Median | 46962998 |
| Mode | #N/A |
| Standard Deviation | 4563654 |
| Sample Variance | 2.08E+13 |
| Kurtosis | -0.68439 |
| Skewness | -0.06445 |
| Range | 19575349 |
| Minimum | 36997641 |
| Maximum | 56572990 |
| Sum | 3.96E+09 |
| Count | 84 |
The passenger-miles refer to the figure of the total passengers multiplied by the miles traveled. The figures are in thousands. It indicates a large variance implying the individual figures vary greatly from each other and also to the mean. The modal figure does not exist in this case.
| Seats Miles (000) | |
| Mean | 58077063 |
| Standard Error | 428768.6 |
| Median | 58227952 |
| Mode | #N/A |
| Standard Deviation | 3929729 |
| Sample Variance | 1.54E+13 |
| Kurtosis | -0.50572 |
| Skewness | -0.22102 |
| Range | 17749157 |
| Minimum | 47817552 |
| Maximum | 65566709 |
| Sum | 4.88E+09 |
| Count | 84 |
Descriptive Statistics for the Load Factor, Passenger Miles, and Seat Miles for the Carrier American Airlines
| Monthly Load Factor | |
| Mean | 83.57262 |
| Standard Error | 0.422923 |
| Median | 83.785 |
| Mode | 90.17 |
| Standard Deviation | 3.876155 |
| Sample Variance | 15.02458 |
| Kurtosis | -0.78039 |
| Skewness | -0.17572 |
| Range | 14.73 |
| Minimum | 75.72 |
| Maximum | 90.45 |
| Sum | 7020.1 |
| Count | 84 |
| Revenue Passenger Miles (000) | |
| Mean | 5536724.536 |
| Standard Error | 57776.27412 |
| Median | 5500724 |
| Mode | #N/A |
| Standard Deviation | 529528.299 |
| Sample Variance | 2.804E+11 |
| Kurtosis | -0.442719317 |
| Skewness | 0.081447648 |
| Range | 2377240 |
| Minimum | 4354653 |
| Maximum | 6731893 |
| Sum | 465084861 |
| Count | 84 |
| Seat Miles (000) | |
| Mean | 6610668 |
| Standard Error | 54776.48 |
| Median | 6463288 |
| Mode | #N/A |
| Standard Deviation | 502034.8 |
| Sample Variance | 2.52E+11 |
| Kurtosis | -0.83848 |
| Skewness | 0.302864 |
| Range | 1996725 |
| Minimum | 5593109 |
| Maximum | 7589834 |
| Sum | 5.55E+08 |
| Count | 84 |
Overall Means Comparison and Implication
In comparing the figures from American Airlines to the overall statistics for all domestic American airlines, the figures differ, though not hugely. For instance, the mean for all domestic airlines is 81.05774 compared to a mean of 83.57262 for American Airlines. This implies that since the count is equal, the average seating capacity for the American Airlines Flights Company is slightly higher than the average capacity of all the domestic airlines put together. In an instance where the figure of a variable is above the mean, it indicates that the variable performs better than the rest. A high load factor implies the planes have the most seats occupied in each flight, which translates to more revenue generation and, consequently, profits.
Monthly Seat Miles Available
Available Seat Miles (ASM) indicates the number of passenger travel miles available at a given flight period. It directly translates to the capacity of the airline. For this data item, the seat miles for American Airlines slightly differ from the figure for all domestic airlines altogether. The monthly seat miles data plays a vital role in determining the income generated when the planes are filled to a certain point (Beers, 2019). Investors can use the information about a certain revenue amount for every passenger to determine when the airline has covered the costs and is making a profit. Thus, from the analyzed data, American Airlines seem more profitable for the period between January 2006 to December 2012.
Monthly Revenue Passenger Miles Comparison and Implication
Revenue Passenger Miles is a product of the paying traveling passengers and the distance covered in miles. The higher the revenue passenger mile for an airline, the more the load factor for that particular airline. This is because the load factor is obtained by dividing the revenue passenger mile for the airline by the number of available seat miles (Beers, 2019). This is the perceived and factual relation between load factor and revenue passenger mile.
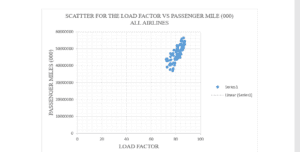
Scatter Plots for All the US Airline Data

THE LOAD FACTOR VS PASSENGER MILE (000) AMERICAN AIRLINES
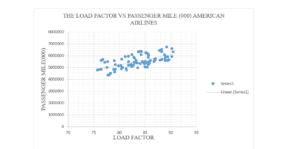
Scatter Plots for American Airlines Data

THE LOAD FACTOR VS PASSENGER MILE (000) AMERICAN AIRLINES
Though weirdly scattered, the implication of the scatter plot indicates a relationship between passenger miles and load factor. The vague representation of direct proportionality can be identified from the graph, though insufficient to conclude the association (Rumsey, 2016). Both indicate that an increase in passenger revenue miles increases the load factor. The “clumsy uphill pattern” thus indicates a positive relationship between the two variables in consideration for the two data sets.
References
Beers, B. (2019). How Does Load Factor Impact Airline Profitability https://www.investopedia.com/ask/answers/041515/how-can-i-use-load-factor-indicator-profitability-airline-industry.asp
Bureau of Transportation Statistics, U.S. Department of Transportation T-100 Segment data.
Rumsey, D. (2016). Statistics For Dummies. Colombus: Ohio State University.
ORDER A PLAGIARISM-FREE PAPER HERE
We’ll write everything from scratch
Question 
1.4 – Data Assignment
Business Research Data
Quantitative research involves the analysis of data. Often there are databases available or government data available for free on the internet. There are also proprietary databases that can provide data as well. For this assignment. you will collect data and begin the analysis of the data.

Business Research Data
NOTE: save the data collected because you will continue to perform additional analysis of the data as the term progresses. Hint: for collecting data, try the Research and Innovative Technology Administration, Bureau of Transportation Statistics website. You will have to do some searching to find the data. Look around the reference website. the data are there.
For the first module, you need to collect cumulative data for all U.S. major carriers for the time period of January 2006 through December 2012. The data you collect should include monthly load factors, monthly revenue passenger miles, and monthly available seat miles (Domestic flights only).
Once you have collected the data, clean the data as necessary (i.e. sometimes monthly data will include a total for each year in the data set). If you keep the annual total in the data set it could skew some of your results. Also. remember the question asks for domestic data only. For the period in question calculate the following summary statistics for each data item collected:
- Mean
- Median
- Mode
- Standard Deviation o Variance
- Minimum and maximum
In addition to data for all U.S. carriers collect the same data of a single U.S. airline. clean the data. and calculate the same summary statistics for the particular airline you selected.
Create a scatter plot for all of the US airline data with revenue passenger miles on the y-axis and load factor on the x-axis. Do the same for the individual airline you have selected. Make sure your scatter plot includes a title of the plot, labels the x and y-axis with appropriate titles,and uses appropriate scales for each axis (refer to your textbooks for examples).
After completing the above items, prepare a brief (three to four paragraph) discussion of the summary statistics. perceived relation between load factor and revenue passenger miles (if any), how your selected airline appears to be performing relative to the industry, And any other information you can glean from the data collected. Your write-up should also include a brief discussion identifying where the data was obtained from. Ensure sources are cited and formatted inaccordance with current APA format.
This assignment is intended to get you to start thinking about what your data may or may not be telling you. Certainly, this early inthe term we have not discussed the tools necessary todraw strong inferences.
However, there are items which may appear to be apparent that can be discussed.
Be sure to include summary tables of summary statistics, the scatterplots, and the excel spreadsheet with the data in addition to the brief write-up. When you submit your assignment, use the following naming convention:
Lastname.Firstname.CourseActivity.file extension. For example, Iwould have two documents to turn in: Mau.Ron.MBAA522.1.4.docx. and Mau.Ron.MBAA522.1.4.xlsx.
Review the Data Assignment Rubric before submitting your completed assignment Read through the rubric carefully and note that spreadsheets must include the formulas where applicable.Within a cell with a result, the formula should bevisible if the cell is selected. Formulas are not necessary insummary tables. which should just include the results.
For all assignments: When a Word document is submitted, the Word document will be formatted per current APA, title page. abstract, body, references, and table or figures or both as appropriate. The paper body will be in paragraph form, not bullet statements. The rubric includes sections for an explanation of results. organization. expression, etc…and of course APA. The rubric is attached. If grammar, spelling, or APA are less than 3. then 50% of points can be deducted.