Smart Parking Space – Presentation

Hello. As the city manager, I am privileged today to discuss the issue of parking space in our city following the anticipated increase in population and, thus, traffic congestion.
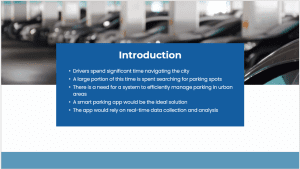
The lack of adequate parking has been one of the main issues faced by drivers in the city for a long time. Drivers have complained bitterly over the amount of time spent waiting to find a parking slot. The unavailability of spaces causes additional traffic and jams. In response to this consistent setback, the city intends to design an app that will give drivers instant feedback on accessible car parks. The app will draw data in real time to give drivers the most up-to-date information pertaining to the availability of car parks.
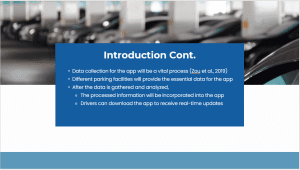
The viability of the app will be highly dependent on data related to the availability of parking lots. It is a sophisticated effort, but collecting data is a crucial step to enable the success of the smart parking program (Zou et al., 2019). Each car park in the city will feed data to make the program work. Once data and analysis have been gathered, the findings need to be incorporated into the program. Users will have a current database of where to park in the city.
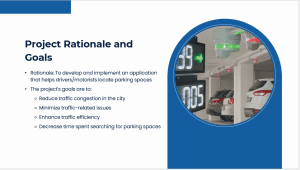
The proposed project of the city has distinct objectives and a reason behind the new development of the smart parking app. The chief purpose is to make an application that will aid drivers in finding accessible parking spots within the city. As the ease of finding a place to park is becoming more and more difficult, the project has established some main objectives. One of them is to alleviate traffic congestion, a matter that is of much concern to the city. The project also seeks to solve traffic issues, such as crashes and violations. The efficiency will be increased by reducing the time spent trying to find a spot.
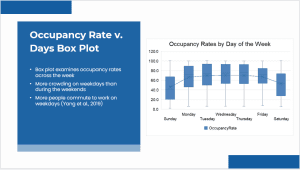
Examining the box plots of the week, there is a consistent difference in the varying days. Every day has a different median occupancy rate, with Tuesdays having the highest and Sundays having the lowest. The box plot also indicates that the occupancy rate tends to be elevated on weekdays compared to weekends. This is as expected since the city tends to have more activities on weekdays compared to weekends. The city tends to be more crowded on weekdays than weekends because people are commuting to work there (Yang et al., 2019), whereas there are fewer working individuals over weekends.
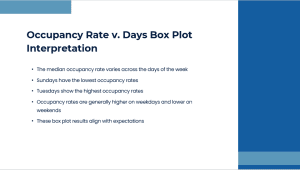
The occupancy rate box plot over the days of the week indicates that each day has a different median occupancy rate. The highest occupancy rate is found on Tuesdays, and the lowest is found on Sundays. Weekdays also tend to have higher occupancy rates than weekends. This was expected since the city tends to have more activity levels during the weekdays when people are commuting to and from work. Fewer people work over weekends, hence lower occupancy levels.
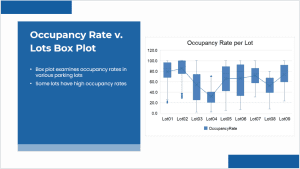
The box plot of occupancy by lots reveals variability, with some lots more highly occupied than others. Some of the lots with the highest occupancy include Lot03, Lot05, and Lot06. This is consistent with expectations since the demand and supply of car parks vary by different areas. Location and accessibility are probably responsible for the variability in occupancy across different lots. This variability in occupancy was expected, reflecting the dynamic use of car park space in the area.
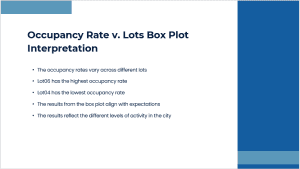
The box plot of occupancy by lot strongly indicates that different lots have different levels of occupancy. Lot06 is the lot with the highest level of occupancy, and Lot04 has the least. This is expected since people will be working in different parts of the city, and thus, some areas will have more demand for parking lots. Some areas of the city are more active and thus have more demand for parking lots, whereas others are less. This disparity in occupancy levels mirrors the different levels of activity in the different parts of the city and varying car park demands.
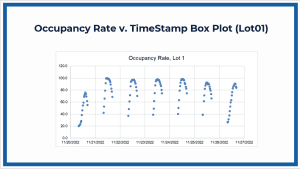
Motorists and drivers usually seek parking at different moments of the day, and with time, occupancy increases. This pattern is witnessed at different timestamps. By referring to the box plot for Lot01, we can infer that the occupancy rate is subject to the time of day. The peak occupancy rate occurred on November 21, 2022, reflecting increased demand for parking at this time. This is a pattern that reflects the dynamic character of occupancy of office spaces over time, with demand usually rising at particular hours.
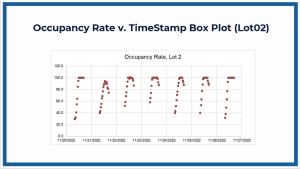
The box plot of Lot02 reflects a pattern that is similar to that of Lot01, with the occupancy rate rising over time. This indicates that the occupancy rate is time-dependent. When the box plot of Lot02 is closely looked at, the peak occupancy levels are seen within the time frame that spans November 21, 2022, to November 22, 2022. It can be assumed that certain events or activities were scheduled to occur within this time frame, and this led to a peak in the demand for parking. Such a pattern indicates the connection between occupancy levels and the time frame of certain events, resulting in a peak demand for parking within those periods.
Drivers and motorists have consistently had a hard time finding free parking spaces, and this has been a cause of concern for the city. In order to solve this issue, the city intends to create a smart parking app that will monitor empty car parks and give drivers and motorists real-time updates. This app is valuable since it will enable drivers and motorists to easily identify free parking spots. As such, I recommend the city to implement this strategy to create the app. The city could also include additional parking spots in areas with full occupancy to alleviate traffic. This will cut traffic, simplify traffic flow, and save time for drivers and motorists.
References
Yang, S., Ma, W., Pi, X., & Qian, S. (2019). A deep learning approach to real-time parking occupancy prediction in transportation networks incorporating multiple spatio-temporal data sources. Transportation Research Part C Emerging Technologies, 107, 248–265. https://doi.org/10.1016/j.trc.2019.08.010
Zou, M., Wang, Q., & Liu, S. (2019). Optimization of parking space allocation for automated parking system of paternoster type by genetic algorithm. In 2019 Chinese Control And Decision Conference (CCDC). IEEE. https://doi.org/10.1109/ccdc.2019.8833243
ORDER A PLAGIARISM-FREE PAPER HERE
We’ll write everything from scratch
Question 
Smart Parking Space – Presentation
As a city manager for a mid-size city, you must be able to examine patterns and trends to highlight organizational performance and support organizational strategic planning. One of the ways that is done is through analyzing the statistics. Still, just presenting the numbers is not always the most efficient way to present your analysis.
Smart Parking Space – Presentation
Scenario
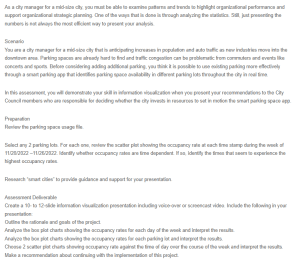
You are a city manager for a mid-size city that is anticipating increases in population and auto traffic as new industries move into the downtown area. Parking spaces are already hard to find and traffic congestion can be problematic from commuters and events like concerts and sports. Before considering adding additional parking, you think it is possible to use existing parking more effectively through a smart parking app that identifies parking space availability in different parking lots throughout the city in real time.
In this assessment, you will demonstrate your skill in information visualization when you present your recommendations to the City Council members who are responsible for deciding whether the city invests in resources to set in motion the smart parking space app.
Preparation
Review the parking space usage file.
Select any 2 parking lots. For each one, review the scatter plot showing the occupancy rate at each time stamp during the week of 11/20/2022 –11/26/2022. Identify whether occupancy rates are time dependent. If so, identify the times that seem to experience the highest occupancy rates.
Research “smart cities” to provide guidance and support for your presentation.
Assessment Deliverable
Create a 10- to 12-slide information visualization presentation including voice-over or screencast video. Include the following in your presentation:
Outline the rationale and goals of the project.
Analyze the box plot charts showing the occupancy rates for each day of the week and interpret the results.
Analyze the box plot charts showing the occupancy rates for each parking lot and interpret the results.
Choose 2 scatter plot charts showing occupancy rate against the time of day over the course of the week and interpret the results.
Make a recommendation about continuing with the implementation of this project.