Predicting an Outcome Using Regression Models
Data and data modelling are vital strategic aspects in informing an organization’s decision-making. One of the models that can be useful in data modelling for decision-making is a regression model. A regression model helps us to establish a relationship between a dependent variable and an outcome to determine the most effective strategies for a favourable outcome. For several explanatory variables that have an impact on an outcome variable, the multiple regression model establishes the relationship and the magnitude of the impact of independent variables on a dependent variable. The current assessment aims at performing an analysis using a regression model to offer recommendations in a healthcare context. Particularly, the analysis will be used to inform the hospital’s management on reimbursement decisions.
Generating Multiple Regression from a Dataset
Interpretation of the Effect Size and Statistical Significance of the Regression Output
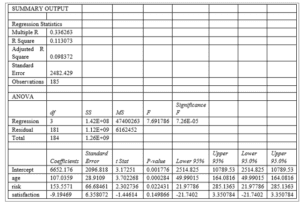
The p-value from the regression output shows that the regression model is a significant predictor of the relationship between risk factors, age, satisfaction, and hospital costs in dollars. The Significance F value in the table indicates that the overall model predicts the outcome (Frey, 2018). Further, the p-values for the individual independent variables indicate that all variables significantly predict healthcare costs since all p-values are less than 0.05, except satisfaction. A large p-value indicates that we accept the null research hypothesis and conclude that the independent variable does not significantly predict the outcome variable. The beta values also indicate the effect of explanatory variables on the outcome variable. The beta values also imply that an increase in risk factors and the age of the patients will contribute to higher hospital costs, while satisfaction has a positive association with the age outcome.
The coefficients of correlation show the effect size for the model. The coefficient of Age indicates that for every one-year increase in patients’ Age, the hospital costs increase by 107.0359 dollars. The coefficients of correlation indicate that a unit increase in the risk factor will lead to an increase in hospital costs by 153.5571 dollars. A negative correlation between the level of satisfaction and hospital costs implies that the higher the level of satisfaction, the lower the hospital costs (1 1-unit increase in the level of satisfaction leads to a decrease in hospital costs by 9.19469 dollars). Thus, age and risk factors have a huge effect on hospital costs compared to the level of satisfaction based on the effect sizes.
Interpretation of the Fit of the Regression Model
The R-squared value, which also represents the coefficient of determination of the model, shows the fitness of the regression model. The R-squared value shows the distribution of the data points along the regression line. The R-squared value also indicates the magnitude of the change in the outcome variable that is accounted for by the independent variables (Field, 2018). The R-squared value for the model implies that the model’s explanatory variables explain 11% of the change in the outcome variable (R-squared= 0.113073). The R-squared value is also a goodness of fit test, and in this context, it indicates that 11% of the data points are on the regression line. Therefore, since R-squared is a goodness of fit test, a high R-squared value indicates that the model better predicts the actual outcome, as Gallo (2015) points out. A small R-squared value implies that making a decision based on the data used to generate the model may lead to huge variations from reality.
Applicability of the Multiple Regression Analysis Output for Health Care Decisions
The regression model shows the relationship between the independent variable and the effect on the outcome variable;
Summary of the Results and Practical Implications
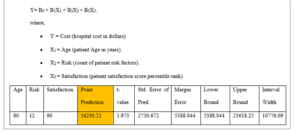
The regression model indicates that patients’ age and risk factors significantly predict hospital costs in dollars. Based on the p-values, age is a stronger predictor of hospital costs than risk factors. This implies that the patient’s age can help the hospital predict the range of costs. The hospital can, however, replace satisfaction scores with other more significant factors in predicting hospital costs. Thus, the hospital’s management can replace the satisfaction percentile rank with other factors to generate a model with significant predictors. The point prediction value shows that the higher the risk factors, the higher the hospital costs. Additionally, a low patient satisfaction score increases hospital costs. Thus, increasing the level of satisfaction by improving patient outcomes reduces hospital costs. Therefore, higher reimbursement is necessary when the hospital has a higher number of elderly patients than younger patients and when the hospital has patients with several risk factors.
References
Field, A. (2018). Discovering statistics using IBM SPSS Statistics. London: Sage Publishers.
Frey, B. B. (Ed.). (2018). Multiple linear regression. In The SAGE encyclopedia of educational research, measurement, and evaluation (Vols. 1–4). Thousand Oaks, CA: Sage.
Gallo, A. (2015). A refresher on regression analysis. Harvard Business Review Digital Articles, 2–9.
ORDER A PLAGIARISM-FREE PAPER HERE
We’ll write everything from scratch
Question 
Perform multiple regression on the relationship between hospital costs and patient age, risk factors, and patient
satisfaction scores, and then generate a prediction to support this healthcare decision. Write a 3-4 page analysis
of the results in a Word document and insert the test results into this document.
Predicting an Outcome Using Regression Models
IInnttrroodduuccttiioonn
Note: You are strongly encouraged to complete the assessments in this course in the order they are presented.
Regression is an important statistical technique for determining the relationship between an outcome
(dependent variable) and predictors (independent variables). Multiple regression evaluates the relative predictive
contribution of each independent variable on a dependent variable. The regression model can then be used for
predicting an outcome at various levels of the independent variables. For this assessment, you will perform
multiple regression and generate a prediction to support a healthcare decision.
OOvveerrvviieeww && PPrreeppaarraattiioonn
Download the Assessment 3 Dataset [XLSX].
The dataset contains the following variables:
• cost (hospital cost in dollars).
• age (patient age in years).
• risk (count of patient risk factors).
• satisfaction (patient satisfaction score percentile rank).
IInnssttrruuccttiioonnss
Hospital administration needs to decide on the amount of reimbursement required to cover expected
costs for next year. For this assessment, using information on hospital discharges from last year, multiple
regressions were performed on the relationship between hospital costs and patient age, risk factors, and patient satisfaction
scores, and then a prediction was generated to support this healthcare decision. Write a 3–4 page analysis of the
results in a Word document and insert the test results into this document (copied from the output file and pasted
into a Word document). Refer to Copy From Excel to Another Office Program for instructions.
Submit both the Word document and the Excel file that shows the results.
GGrraaddiinngg CCrriitteerriiaa
The numbered assessment instructions outlined below correspond to the grading criteria in the Predicting an
Outcome Using Regression Models Scoring Guide, so be sure to address each point. You may also want to
review the performance-level descriptions for each criterion to see how your work will be assessed.
1. Perform the appropriate multiple regression using a dataset.
2. Interpret the statistical significance and effect size of the regression coefficients of a data analysis.
◦ Interpret p-value and beta values.
Assessment 3 Instructions: Predicting an Outcome Using … https://courserooma.capella.edu/webapps/blackboard/content/listContent…
2 of 3 12/22/2022, 4:22 PM
3. Interpret the fit of the regression model for the prediction of a data analysis.
◦ Interpret R-squared and goodness of fit.
4. Apply the statistical results of the multiple regression of a data analysis to support a health care decision.
◦ Generate a prediction with a regression equation.
5. Write a narrative summary of the results that include practical, administration-related implications of the
multiple regression.
6. Write clearly and concisely, using correct grammar, mechanics, and APA formatting.
AAddddiittiioonnaall RReeqquuiirreemmeennttss
Your assessment should meet the following requirements:
• Written communication: Write clearly, accurately, and professionally, incorporating sources appropriately.
• Length: 3–4 pages
• Resources: Not required.
• APA format: Cite your sources using the current APA format.
• Font and font size: Times Roman, 10 points.
CCoommppeetteenncciieess MMeeaassuurreedd
By successfully completing this assessment, you will demonstrate your proficiency in the following course
competencies and assessment criteria:
• Competency 2: Analyze data using computer-based programming and software.
◦ Perform the appropriate multiple regression using a dataset.
• Competency 3: Interpret results of data analysis for value-based health care decisions, policy, or practice.
◦ Interpret the statistical significance and effect size of the regression coefficients of a data analysis.
◦ Interpret the fit of the regression model for prediction of a data analysis.
• Competency 4: Present results of data analysis to support a decision or recommendation.
◦ Apply the statistical results of the multiple regression of a data analysis to support a health care
decision.
◦ Write a narrative summary of the results that include practical, administration-related implications
of the multiple regression.
• Competency 5: Communicate audience-appropriate health management content in a logically structured
and concise manner, writing clearly with the correct use of grammar, punctuation, spelling, and APA style.
◦ Write clearly and concisely, using correct grammar, mechanics, and APA formatting.