Metrics for Innovation
Suitable Measures of Innovation and Creativity.
What the Number of Active Products Indicates
Many active products indicate incremental innovation because users can access active products. The company can then focus on improving the products based on customer reviews and recommended improvement areas. However, the number of active projects does not indicate whether the companies have innovation and whether the innovation is discontinuous or incremental.
Determining if Research and Development (R&D) Headcount Indicates Labor Efficiency or Innovation
The research and development headcount indicates labor efficiency by representing the number of workers handling the innovation. Labor efficiency measures the ability to use labor according to the project’s expectations. It dictates the quantity and quality of goods and services produced within a specific time and under particular conditions. Therefore, the research and development headcount indicates the worker’s productive capacity.
The Consequences of Any of These Metrics Increasing Over Time
The increase in the metrics would mean adjustments in the project deliverables. For instance, labor efficiency would increase if there were changes in the wirer’s productive capacity based on changes in project deadline and complexity. The number of active products will increase with continuous incremental innovation based on customer demand.
Evaluating and Selecting the Company (INAGG, Inc. or AMMB, Inc.) Most Likely to Have a Culture That Supports Innovation and Creativity.
Would Using Non-R&D Staff Time Committed to Experimenting with New Products Be a Gauge of an Innovation Culture
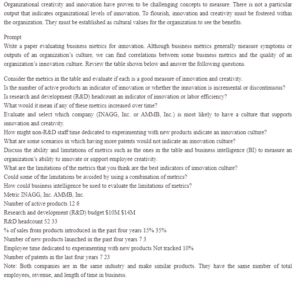
Non-research and development staff time set aside to experiment with new products can gauge an innovation culture based on the time set aside. Companies that spend a lot of time on research and development have a culture that supports innovation. In contrast, those with more non-research and development staff time committed to experimenting with new products do not have a culture of innovation. Based on the data in the table, INAGG has a research and development headcount of 52, while AMBB has a research and development headcount of 33. AMBB sales are higher than INAGG’s, indicating that AMBB has an innovation culture that promotes continuous innovation to meet customers’ needs.
Examples Whereby Having More Patents Would Be a Bad Indicator of an Innovation Culture
In innovation, patents allow innovators to gain exceptionality over a new process or product, advance a solid market position, and generate more profits through licensing. Companies usually seek patents at the research and development phase in the technology life cycle. Having more patents would not indicate an innovation culture at any point because innovative cultures are not dependent on patents.
The Ability and Limitations of Metrics and Business Intelligence (BI) to Measure the Capability of an Organization to Invent or Support Employee Creativity.
The Limits of the Metrics That Are the Best Indicators of Innovation Culture
One limitation that indicates a culture of innovation is the restriction of innovation in departments based on numbers or data. In some instances, a department may restrict innovation if the department members disagree with it due to how it negatively impacts them. For example, workers in the customer service department may object to innovation aimed at automating customer care services because it would replace their jobs. The second limitation is the lack of finance to fund the innovation process. Investors may be reluctant to support innovation if it does not increase profits, eliminating innovation culture.
Avoiding Limitations Using a Combination of Metrics
Some limitations could be avoided by combining metrics and using business intelligence to weigh the organization’s ability to support the innovation through funding. Business intelligence could also determine whether the organization’s workforce has the skills and expertise to implement the innovation.
Using Business Intelligence to Evaluate Limitations of Metrics
Business intelligence includes the technical and procedural infrastructure used to gather, store, and analyze the data produced by the company’s activities. Therefore, it could be used to evaluate past data where the innovation team experienced limitations and how the incidents compare to projects without the limitation metrics. This can help determine the impact of the limitation metrics on the project and design possible practical solutions. Business intelligence could also prepare the project team on limitations that can be avoided and how to avoid them.
ORDER A PLAGIARISM-FREE PAPER HERE
We’ll write everything from scratch
Question 
Organizational creativity and innovation have proven to be challenging concepts to measure. There is not a particular output that indicates organizational levels of innovation. To flourish, innovation and creativity must be fostered within the organization. They must be established as cultural values for the organization to see the benefits.
Metrics for Innovation
Prompt
Write a paper evaluating business metrics for innovation. Although business metrics generally measure symptoms or outputs of an organization’s culture, we can find correlations between some business metrics and the quality of an organization’s innovation culture. Review the table shown below and answer the following questions.
Consider the metrics in the table and evaluate if each is a good measure of innovation and creativity.
Is the number of active products an indicator of innovation, or whether the innovation is incremental or discontinuous?
Is research and development (R&D) headcount an indicator of innovation or labor efficiency?
What would it mean if any of these metrics increased over time?
Evaluate and select which company (INAGG, Inc. or AMMB, Inc.) is most likely to have a culture that supports innovation and creativity.
How might non-R&D staff time experimenting with new products indicate an innovation culture?
What are some scenarios where having more patents would not indicate an innovation culture?
Discuss the ability and limitations of metrics such as the ones in the table and business intelligence (BI) to measure an organization’s ability to innovate or support employee creativity.
What are the limitations of the metrics that you think are the best indicators of innovation culture?
Could some of the limitations be avoided by using a combination of metrics?
How could business intelligence be used to evaluate the limitations of metrics?
Metric INAGG, Inc. AMMB, Inc.
Number of active products 12 6
Research and development (R&D) budget $10M $14M
R&D headcount 52 33
% of sales from products introduced in the past four years 15% 35%
Number of new products launched in the past four years 7 3
Employee time dedicated to experimenting with new products Not tracked 10%
Number of patents in the last four years 7 23
Note: Both companies are in the same industry and make similar products. They have the same number of total employees, revenue, and length of time in business.