Genetics and Academic Achievement
1) Describe a research question in psychology that interests you. Also, state a hypothesis for an experiment related to your research question.
Research Question: What is the relationship between academic achievement, genetics, and the environment in adopted children?
Hypotheses
- Hypotheses 1:
Null Hypothesis: Adopted children have lower average GPAs at school compared to biological children.
Alternative Hypothesis: Adopted children have a higher average GPA at school compared to biological children.
- Hypotheses 2:
Null Hypothesis: There is no relationship between genetic relation and academic achievement
Alternative Hypothesis: There is a relationship between genetic relation and academic achievement
2) How might you test your hypothesis? Briefly describe the procedure you would use, and discuss the independent variable(s) and dependent variables (s).
The critical variables for this study were genetic relation as the independent variable and academic achievement as the dependent variable. The independent variable was categorical, indicating whether the child was adopted or biological. The dependent variable was measured through academic performance, particularly the average GPA.
An independent sample T-test for the difference in mean GPA was conducted to test the first hypothesis. The second hypothesis was tested using a correlation test and regression analysis between genetics and academic performance. The correlation coefficient value confirmed the theory. The regression analysis also confirmed the significance of the relationship.
3a) In SPSS, enter hypothetical data for at least 15 participants. To do this, you must first create the variables in the “Variable View.” You must then enter the data in the “Data View.” When entering your hypothetical data, be sure to:
- Name each variable
- Use a label to provide more detail about each variable
- Enter values for your variable conditions
The data file will be submitted along with this worksheet.
Hire our assignment writing services if your assignment is devastating you.
3b) Explain each of your variables. More specifically, which variable is the IV, and which is the DV? How would the variables be measured? How should the values be interpreted? For example, if your variable values are 1, 2, or 3, what do each of those numbers represent?
As mentioned, the independent variable is genetic relation. The independent variable has two levels: value one corresponds to biological children, and value two corresponds to adopted children. The dependent variable is academic achievement, which is the average GPA academic performance for the children for the last 5-8 years of schooling. The GPA scale is a scale of 0-4, where 0-1.0= Grade D, 1.0-2.0= Grade C, 2.0-3.0= Grade B, and 3.0-4.0= Grade A. The mean GPA values are used to compare the performance of the adopted and biological children, as shown in the T-test output table.
A sample of 20 participants, with 11 biological children and nine adopted children, was used for the hypothetical data. Value label 1 in the data view under Genetics represents the natural children, while value label 2 represents the adopted children. The regression output confirms the second hypothesis by showing a relatively strong positive relationship (R=0.639) between genetic relations and education achievement. The relationship between the variables is significant at a 5% significance level since the p-value is 0.002<0.005. However, the model explains 41% of the relationship between the variables. The T-test for the mean difference indicates that biological children have a higher average GPA than adopted children at a 1% significance level, which means we accept the null hypothesis.
SPSS Analysis Outputs
Correlation Output from IBM SPSS Within VDI
Regression Analysis Output from IBM SPSS Within VDI
Descriptive Statistics Output from IBM SPSS Within VDI
T-test for Difference in Mean
ORDER A PLAGIARISM-FREE PAPER HERE
We’ll write everything from scratch
Question 
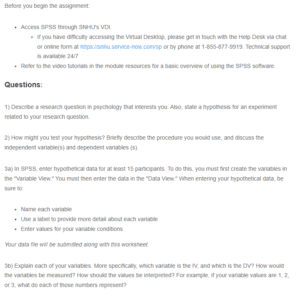
Before you begin the assignment:
- Access SPSS through SNHU’s VDI.
- If you have difficulty accessing the Virtual Desktop, please get in touch with the Help Desk via chat or online form at https://snhu.service-now.com/sp or by phone at 1-855-877-9919. Technical support is available 24/7
- Refer to the video tutorials in the module resources for a basic overview of using the SPSS software.

Genetics and Academic Achievement
Questions:
1) Describe a research question in psychology that interests you. Also, state a hypothesis for an experiment related to your research question.
2) How might you test your hypothesis? Briefly describe the procedure you would use, and discuss the independent variable(s) and dependent variables (s).
3a) In SPSS, enter hypothetical data for at least 15 participants. To do this, you must first create the variables in the “Variable View.” You must then enter the data in the “Data View.” When entering your hypothetical data, be sure to:
- Name each variable
- Use a label to provide more detail about each variable
- Enter values for your variable conditions
Your data file will be submitted along with this worksheet.
3b) Explain each of your variables. More specifically, which variable is the IV, and which is the DV? How would the variables be measured? How should the values be interpreted? For example, if your variable values are 1, 2, or 3, what do each of those numbers represent?