FIN 320 Project Two Financial Analysis Report
Financial Calculations
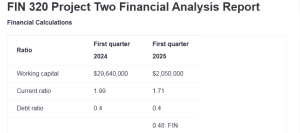
| Ratio | First quarter 2024 | First quarter 2025 |
| Working capital | $29,640,000 | $2,050,000 |
| Current ratio | 1.99 | 1.71 |
| Debt ratio | 0.4 | 0.4 |
| Earnings per share | 0.12 | 0.48: FIN 320 Project Two Financial Analysis Report |
| Price/earnings ratio | 364.78 | 348.49 |
| Total asset turnover ratio | 0.15 | 0.2 |
| Financial leverage | 1.66 | 1.67 |
| Net profit margin | 2.10% | 6.70% |
| Return on assets | 0.003 | 0.013 |
| Return on equity | 0.56 | 2.16 |
Fiscal Quarter Comparison
| Ratio | First quarter 2025 | First quarter 2024 | Difference |
| Working capital | $29,640,000 | $2,050,000 | $27,590,000.00 |
| Current ratio | 1.99 | 1.71 | 0.28 |
| Debt ratio | 0.4 | 0.4 | 0 |
| Earnings per share | 0.12 | 0.48 | -0.36 |
| Price/earnings ratio | 364.78 | 348.49 | 16.29 |
| Total asset turnover ratio | 0.15 | 0.2 | -0.05 |
| Financial leverage | 1.66 | 1.67 | -0.01 |
| Net profit margin | 2.10% | 6.70% | $ (0.05) |
| Return on assets | 0.003 | 0.013 | -0.01 |
| Return on equity | 0.56 | 2.16 | -1.6 |
Comparison Analysis
- Working capital
The business’s working capital was $29.640,000 in the most recent quarter and $21,050,000 in the same quarter last year. As a result, the working capital ratio characterizes the amount of money a company has to use for daily operations. It displays the liquidity of a company’s finances (Louw et al., 2022). Tesla Inc.’s financial situation has been sound when comparing the two fiscal periods.
- Current ratio
In the most recent fiscal quarter, the company’s current ratio was 1.99, while in the same quarter last year, it was 1.71. Over the last two fiscal quarters, the company’s current ratio has increased. The ratio’s value is greater than one, indicating that the business can fully pay its short-term maturing debts when they become due.
- Debt ratio
Tesla Inc.’s debt ratio was 0.39 in the most recent fiscal quarter. In the same quarter last year, the same ratio had a value of 0.40. The debt ratio indicates the proportion of the company’s assets financed by borrowing. A consistent financial performance is shown by the ratio’s negligible growth in value over the two fiscal quarters.
- Earnings per share
The company’s earnings per share ratio was 0.12 in the most recent fiscal quarter. The ratio increased, with a value of 0.47 in the same quarter last year. The increase shows that the financial performance of profit per unit share has improved.
- Price/earnings ratio
In the most recent fiscal quarter, Tesla Inc.’s price-earnings ratio was 364.79, whereas, in the same quarter last year, it was 348.94. A company’s financial health is evaluated by the price-earnings ratio, which considers growth and market value. The company’s financial health has deteriorated according to this metric.
- Total asset turnover ratio
A 0.15 asset turnover ratio was observed for the most recent fiscal quartet assessed. The value for the metric a year ago was 0.067, indicating a reduction in financial performance. Essentially, this could be due to a reduced level of asset management.
- Financial leverage
In the most recent fiscal quarter, the company’s financial leverage was 1.66, while in the same fiscal quarter last year, it was 1.67 for Tesla Inc. The ability of a business to turn a profit on borrowed capital determines its financial leverage. The value of this statistic increased marginally during both examined fiscal periods. The decline in shareholder equity is the main cause of the increase.
- Net profit margin
In the most recent quarter, Tesla Inc.’s net profit margin was 21.97%, compared to 27.76% in the same period last year. By examining an organization’s net profit, the net profit margin calculates its profitability. Due to a 5.79 per cent decline in net profit margin over the two fiscal quarters, Tesla Inc.’s financial situation has gotten worse. The decline could result from the company’s overall income declining throughout the two periods and its expenses increasing.
- Return on assets
In the most recent fiscal quarter, the business’s return on assets was 0.003, while in the same fiscal quarter last year, it was 0.013. A company’s return on assets can be used to gauge its profitability. This ratio indicates that Tesla Inc.’s financial situation has improved throughout the two fiscal quarters under review.
Better asset management in the most recent fiscal seasons may cause the increase. For instance, the business decreased the stock typically kept throughout each quarter.
- Return on equity
Tesla Inc.’s return on equity was 2.16 for the same fiscal quarter last year and 0.056 for the most recent quarter. Notably, this metric assesses a company’s financial standing in terms of generating profits for stock held by the business. However, because there was a positive change between the two quarters, comparing them shows better financial health. For instance, the management’s use of equity capital to grow the company was more effective.
Short-Term Financing
The ability of a business to raise money for liquidity commitments depends on short-term financing. The corporation under analysis is now in outstanding financial health. The company is at risk of experiencing financial troubles because its current ratio is less than two, which is the industry-recommended figure.
Accordingly, using options for short-term funding, such as marketable securities, can increase the company’s liquidity and lessen the strain of meeting short-term maturing liabilities (Huang, 2023). They could thereby strengthen the business’s immediate financial situation.
References
Huang, W. (2023). Understanding Tesla’s Financial Strength: Analysis of Financial Reports and DuPont Analysis. Highlights in Business, Economics and Management, 6, 250-261.
Louw, E., Hall, J. H., & Pradhan, R. P. (2022). The relationship between working capital management and profitability: evidence from South African retail and construction firms. Global Business Review, 23(2), 313-333. https://doi.org/10.1177/0972150919865104
ORDER A PLAGIARISM-FREE PAPER HERE
We’ll write everything from scratch
Question 
FIN 320 Final Project Milestone Two Guidelines and Rubric
Overview
This is the second milestone leading up to your final project. In Final Project Milestone One, you introduced the business you chose. You examined its financial statements and financial health and reported its financial values. In Final Project Milestone Two, you will make calculations based on the latest information found using Mergent Online about your company and compare the totals with those of one year ago.
You will then use these figures to decide whether short-term financing is needed to improve your company’s financial health. Before moving forward, review your instructor’s feedback for Milestone One and incorporate any suggestions.
Scenario
The CFO of your company has asked for your support in preparing a report for the business’s board of directors. Many of the board members are new, and some of them have little background in finance. With this in mind, you will need to write a report that all board members can easily understand.
Directions
For the company you chose for your final project, open the following documents:
- The balance sheet, income statement, and cash flow statement from the latest fiscal quarter (from Mergent Online)
- The Ratios Most Recent Fiscal Qtr worksheet in the Final Project Financial Formulas workbook (linked in the What to Submit section).
- example, if the latest fiscal quarter available is the third quarter in 2023, you’ll compare those results to the same financial calculations from the third quarter in 2022.
Use the documents to calculate key financial ratios.
Then open the following documents:
- The balance sheet, income statement, and cash flow statement from the same fiscal quarter one year ago
- The Ratios Same Fiscal Qtr 1 Year Ago worksheet
Use the documents to calculate the same financial ratios. Finally, compare those ratios and analyze your results.
Specifically, you must address the following rubric criteria:
FIN 320 Project Two Financial Analysis Report
- Financial Calculations. Calculate accurate financial formulas to assess the business’s current financial health. Specifically, calculate the following formulas using the Ratios Most Recent Fiscal Qtr and the Ratios Same Fiscal Qtr 1 Year Ago worksheets in the Final Project Financial Formulas workbook:
- Working capital
- Current ratio
- Debt ratio
- Earnings per share
- Price and earnings ratio
- Total asset turnover ratio
- Financial leverage
- Net profit margin
- Return on assets
- Return on equity
- Fiscal Quarter Comparison. Summarize the differences between the following:
- The results from your financial calculations of the most recent fiscal quarter
- The results of the same financial calculations of the same fiscal quarter from one year ago
- For example, if the most recent fiscal quarter available is the third quarter in 2023, you’ll compare those results to the same financial calculations from the third quarter in 2022.
- Comparison Analysis. Explain what your calculations and comparison show about the business’s current financial health. Give examples to support your explanation for the following questions:
- Do the results show the business is financially healthy or unhealthy? Which results indicate this?
- What might be the causes of the business’s financial success or failure?
- Is more information needed to determine the business’s financial health? If so, which pieces of information might still be needed?
- Short-Term Financing. Explain how potential short-term financing sources could help the business raise funds needed to improve its financial health. Base your response on the business’s current financial information.
What to Submit
Your submission should be a 2- to 3-page Word document (not including title and resource pages) with 12-point Times New Roman font, double spacing, and one-inch margins. Include the Balance Sheet and Income Statement from Mergent Online with your submission. All sources should be cited using APA style. You must also use the Final Project Financial Formulas workbook and submit the following worksheets:
- The Ratios Most Recent Fiscal Qtr worksheet from the Final Project Financial Formulas workbook
- The Ratios Same Fiscal Qtr1 Year Ago worksheet from the Final Project Financial Formulas workbook