Assessment of Diabetes Self-Management Among Pregnant Women
Step 1: Study Synopsis and Sample Description
This study examined the effectiveness of self-management training on physical activity levels among pregnant women diagnosed with gestational diabetes mellitus (GDM). The researchers investigated whether different self-management strategies influence exercise behavior, measured by daily step counts, and explored the relationship between various predictors and physical activity outcomes: Assessment of Diabetes Self-Management Among Pregnant Women.
The sample consisted of 70 pregnant women newly diagnosed with GDM from various clinics in the area. Participants had a mean age of 38.2 years (SD = 3.0), with ages ranging from 28 to 46 years. The majority (55.7%) identified as Caucasian.
Half of the participants (50%) were classified as overweight or obese at the time of GDM diagnosis. Participants were assigned to one of three self-management training strategies: individualized (n=23), group support (n=23), or web-based (n=24).
Self-efficacy scores averaged 36.5 (SD = 7.6) on a scale measuring confidence in diabetes management activities. At baseline, participants averaged 2,161 steps per day (SD = 299.7), which decreased to 1,953 steps per day (SD = 325.9) at the 60-day follow-up.
Table 1. Descriptive Statistics for Study Variables (N = 70)
| age | caucasian | SMS | bmi_cat | selfeff | start_steps | 60d_steps | |
| Mean | 38.15714 | 0.557143 | 2.014286 | 0.5 | 36.5 | 2160.657 | 1953.171 |
| Standard Error | 0.358647 | 0.059799 | 0.100707 | 0.060193 | 0.909292 | 35.82099 | 38.9532 |
| Median | 38 | 1 | 2 | 0.5 | 38 | 2105.5 | 1880.5 |
| Mode | 37 | 1 | 3 | 1 | 41 | 1992 | 1687 |
| Standard Deviation | 3.000656 | 0.50031 | 0.842578 | 0.50361 | 7.607681 | 299.6999 | 325.9059 |
| Sample Variance | 9.003934 | 0.250311 | 0.709938 | 0.253623 | 57.87681 | 89820.05 | 106214.6 |
| Kurtosis | 2.057816 | -2.00278 | -1.59788 | -2.0597 | -0.92296 | -0.73523 | -0.71621 |
| Skewness | -0.50369 | -0.23515 | -0.02742 | -3.3E-18 | -0.31064 | 0.176803 | 0.428826 |
| Range | 18 | 1 | 2 | 1 | 29 | 1152 | 1311 |
| Minimum | 28 | 0 | 1 | 0 | 20 | 1576 | 1360 |
| Maximum | 46 | 1 | 3 | 1 | 49 | 2728 | 2671 |
| Sum | 2671 | 39 | 141 | 35 | 2555 | 151246 | 136722 |
| Count | 70 | 70 | 70 | 70 | 70 | 70 | 70 |
Step 2: Hypothesis Testing
Hypothesis 1: There is a predictive relationship between BMI status and the number of steps at 60 days while controlling for age and self-efficacy.
- a) Statistical Test Selection
Multiple linear regression was chosen to examine the predictive relationship between BMI status and 60-day step count while controlling for age and self-efficacy. This test is appropriate because we have one continuous dependent variable (60-day steps) and multiple predictor variables, including both continuous (age, self-efficacy) and categorical (BMI status) predictors.
- b) Null Hypothesis
H₀: There is no predictive relationship between BMI status and 60-day step count when controlling for age and self-efficacy (β₁ = 0).
- c) Assumption Checking
The assumptions for multiple linear regression were assessed:
- Linearity: The relationship between predictors and outcome appears linear based on residual plots.
- Independence: Observations are independent as each represents a different participant.
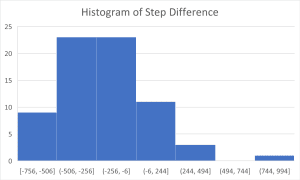
- Normality: The normal probability plot shows residuals following an approximately normal distribution.
- Homoscedasticity: Residual plots indicate relatively constant variance across predicted values.
Figure 1. Residual plots for BMI category, age, and self-efficacy predictors
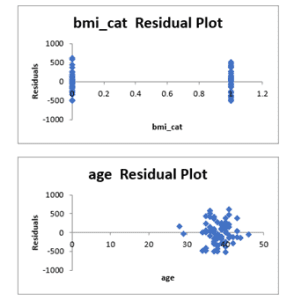
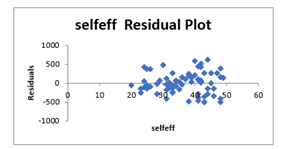
Figure 2. Normal probability plot of residuals
- d) Results Summary
The multiple regression model was statistically significant, F(3, 66) = 7.76, p < .001, explaining 26.1% of the variance in 60-day step counts (R² = .261, Adjusted R² = .227).
BMI status was a significant predictor of 60-day steps (β = 169.66, t = 2.45, p = .017). Participants who were overweight or obese took approximately 170 more steps per day at 60 days compared to those with normal BMI, after controlling for age and self-efficacy. Self-efficacy was also a significant predictor (β = 16.80, t = 3.68, p < .001), with each unit increase in self-efficacy associated with approximately 17 more daily steps. Age was not a significant predictor (β = 11.36, t = 0.99, p = .328).
Table 2: Multiple Regression Analysis Results
| SUMMARY OUTPUT | ||||||||
| Regression Statistics | ||||||||
| Multiple R | 0.51076 | |||||||
| R Square | 0.260875 | |||||||
| Adjusted R Square | 0.227279 | |||||||
| Standard Error | 286.4861 | |||||||
| Observations | 70 | |||||||
| ANOVA | ||||||||
| df | SS | MS | F | Significance F | ||||
| Regression | 3 | 1911907 | 637302.3 | 7.764945 | 0.000162 | |||
| Residual | 66 | 5416903 | 82074.29 | |||||
| Total | 69 | 7328810 | ||||||
| Coefficients | Standard Error | t Stat | P-value | Lower 95% | Upper 95% | Lower 95.0% | Upper 95.0% | |
| Intercept | 821.74 | 471.1231 | 1.744215 | 0.085777 | -118.888 | 1762.368 | -118.888 | 1762.368 |
| bmi_cat | 169.6562 | 69.11421 | 2.454722 | 0.016743 | 31.66523 | 307.6472 | 31.66523 | 307.6472 |
| age | 11.35887 | 11.51724 | 0.98625 | 0.327612 | -11.636 | 34.35379 | -11.636 | 34.35379 |
| selfeff | 16.79948 | 4.566379 | 3.678951 | 0.000473 | 7.682414 | 25.91655 | 7.682414 | 25.91655 |
In practical terms, these findings suggest that contrary to expectations, women with higher BMI actually engaged in more physical activity at the 60-day follow-up. Additionally, women who felt more confident in their ability to manage their diabetes were more physically active, regardless of their BMI or age.
Conclusion: We reject the null hypothesis. There is a significant predictive relationship between BMI status and 60-day step count when controlling for age and self-efficacy.
Hypothesis 5A: Mean 60-day steps will differ from mean number of starting steps per day.
- a) Statistical Test Selection
A paired samples t-test was selected to compare mean steps at baseline versus 60 days. This test is appropriate because we are comparing two measurements from the same participants at different time points, making the observations paired.
- b) Null Hypothesis
H₀: There is no difference between mean baseline steps and mean 60-day steps (μ₁ – μ₂ = 0).
- c) Assumption Checking
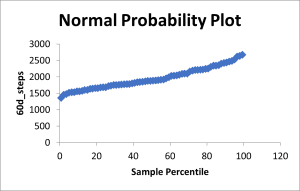
The paired t-test assumes that differences between paired observations are approximately normally distributed. The histogram of step differences shows a roughly normal distribution with slight negative skew, but the sample size (n = 70) is sufficient for the t-test to be robust to minor deviations from normality.
Figure 3. Distribution of step count differences (60-day steps minus baseline steps)
- d) Results Summary
The paired samples t-test revealed a statistically significant decrease in daily steps from baseline (M = 2,161, SD = 299.7) to 60 days (M = 1,953, SD = 325.9), t(69) = 5.90, p < .001. The mean difference was 207.5 steps, representing a 9.6% decrease in daily physical activity.
The correlation between baseline and 60-day steps was moderate (r = .56), indicating that while there was some consistency in individual activity levels, substantial changes occurred. The effect size (Cohen’s d = 0.71) suggests a medium to large practical effect.
Table 3: t-test Analysis Results
| t-Test: Paired Two Sample for Means | ||
| start_steps | 60d_steps | |
| Mean | 2160.657143 | 1953.171 |
| Variance | 89820.05466 | 106214.6 |
| Observations | 70 | 70 |
| Pearson Correlation | 0.559890036 | |
| Hypothesized Mean Difference | 0 | |
| df | 69 | |
| t Stat | 5.896910761 | |
| P(T<=t) one-tail | 6.18337E-08 | |
| t Critical one-tail | 1.667238549 | |
| P(T<=t) two-tail | 1.23667E-07 | |
| t Critical two-tail | 1.994945415 | |
In practical terms, women with GDM in this study became less physically active over the 60-day period following self-management training, with daily steps decreasing by approximately 208 steps on average. This unexpected finding suggests that the self-management interventions may not have been effective in increasing physical activity, or that other factors related to pregnancy progression may have influenced activity levels.
Conclusion: We reject the null hypothesis. There is a significant difference between baseline and 60-day step counts, with participants showing decreased physical activity over time.
Step 3: Box and Whisker Plot
Figure 4. Box and whisker plot of daily steps at baseline and 60 days for normal BMI participants
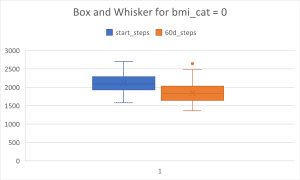
Figure 5. Box and whisker plot of daily steps at baseline and 60 days for overweight/obese participants
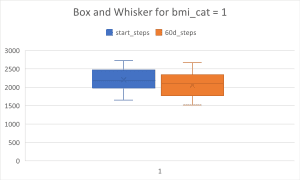
The box plots reveal that both BMI groups experienced decreases in daily steps from baseline to 60 days. For normal BMI participants, median steps decreased from approximately 2,100 to 1,850. For overweight/obese participants, median steps decreased from approximately 2,200 to 2,000.
The overweight/obese group maintained slightly higher step counts at both time points, though both groups showed similar patterns of decline. The plots also show greater variability in the normal BMI group at 60 days, with one notable outlier showing unusually high step counts.
Step 4: Additional Figure
Figure 6. Comparison of average daily steps at baseline and 60-day follow-up
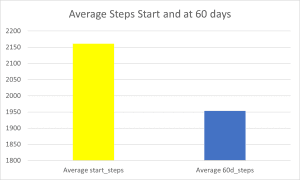
The bar chart illustrates the significant decrease in physical activity from baseline to 60 days post-intervention. Average daily steps declined from 2,161 at baseline to 1,953 at the 60-day follow-up, representing a decrease of approximately 208 steps per day.
This visual representation clearly demonstrates the unexpected finding that self-management training was associated with reduced rather than increased physical activity levels among women with gestational diabetes. The yellow bar (baseline) shows notably higher activity levels compared to the blue bar (60 days), reinforcing the statistical finding of a significant decrease in physical activity over time.
This finding has important clinical implications, suggesting that current self-management training approaches may need modification to effectively promote physical activity among pregnant women with GDM. Factors such as advancing pregnancy, fatigue, or inadequate emphasis on exercise within the training programs may contribute to this decline in activity levels.
ORDER A PLAGIARISM-FREE PAPER HERE
We’ll write everything from scratch
Question 
| Scholarly Project Title |
| Background and aim |
| Gestational diabetes mellitus (GDM) is a form of diabetes that usually develops during the second or third trimester of pregnancy; between 1% and 14% of women develop GDM in pregnancy. Key risk factors for this condition include maternal age over 30 years, obesity and non-Caucasian ethnicity. Pregnancy profoundly affects the management of diabetes and having GDM increases the risk of complications during the rest of the pregnancy for the mother and her baby.
It is important that women’s blood glucose levels are very carefully monitored during pregnancy so that appropriate drug or dietary steps can be taken to control the blood glucose levels and to reduce the risk of complications. Some women only need to change their diets. Others may need to exercise regularly or inject insulin. Self-care is the most usual approach to GDM management, thus patient self-management training is an important strategy with which to improve quality of care. Our goal is to recruit a sample of women newly diagnosed with GDM and to evaluate if self-management training changes their exercise. The sample consists of pregnant women with GDM from various clinics in the area who were offered self-management training via one of three strategies (self-management strategies (SMS): individualized, group support, or web based). In addition to a limited amount of demographic data (age, race, BMI at time of GDM diagnosis), a 25 item scale measured the intensity of self-efficacy for activities of the diabetes regimen where participants described how much they believed they could or could not do what was stated using responses ranging from “very sure I can’t” to “very sure I can” do it. The following statements are examples of the self-efficacy items: “Figure meals and snacks at home” and “Keep track of blood sugar levels” (Cronbach’s alpha=0.84). To assess exercise, each client was given a pedometer to wear which tracked the total number of daily steps taken at baseline (within 2-3 days of GDM diagnosis) and then again 60 days later after starting their self-management training. OK for you to assume normal distribution of the continuous variables. NOTE: This exercise must be done on your own – No group work, sharing or copying. Using the dataset ProposalAnalysis_S25.xlx: Step 1: In your own words write a brief synopsis of the study, describe the sample and the data you have. Include a table (APA format) that includes the appropriate descriptive data of all the variables. Step 2: Select any two of the following hypotheses-if selecting #5 choose only 5A or 5B do not choose both. 1. There is a predictive relationship between BMI status and the number of steps at 60 days while controlling for age and self-efficacy. 2. The number of steps taken at day 60 differs by the self-management strategy. 3. There is an association between BMI status and self-management strategy. 4. There is a correlation and predictive relationship between self-efficacy and the number of steps at 60 days. 5. A. Mean 60 day steps will differ from mean number of starting steps per day. OR B. Mean 60 day steps will differ by BMI status. For each of the two hypothesis selected, in your OWN words summarize a) What is the statistical test you chose and why was this particular test chosen? (Be sure to indicate which hypothesis was chosen) b) State the null hypothesis c) Evidence that you checked that the assumptions for the statistical test you choose were met (must provide evidence). d) Summarize the results by providing the statistical findings as well as interpreting what the findings would mean to someone without using statistical terminology. Indicate if you found support for the null hypothesis or not. (Include summary output tables) Step 3: Create and describe the findings of a box and whisker plot for one of the following: a) The daily steps taken at the start and 60 day follow-up for the two BMI categories. b) Self-efficacy scores for the three self-management groups. Step 4: Use a figure/graphic (APA format) to illustrate something important relevant to one of the hypotheses mentioned above (select either 2, 3 or 5). This must be a figure/graphic other than a box and whisker plot and scatterplots will NOT count as your figure. Include a description of the findings that the figure/graphic portrays in the text. It is OK if you want to integrate the figure/graphic description within your hypothesis testing summary. |
Assessment of Diabetes Self-Management Among Pregnant Women